Immigrants from Germany vs British West Indian Disability Age 5 to 17
COMPARE
Immigrants from Germany
British West Indian
Disability Age 5 to 17
Disability Age 5 to 17 Comparison
Immigrants from Germany
British West Indians
5.9%
DISABILITY AGE 5 TO 17
1.9/ 100
METRIC RATING
244th/ 347
METRIC RANK
5.8%
DISABILITY AGE 5 TO 17
5.4/ 100
METRIC RATING
226th/ 347
METRIC RANK
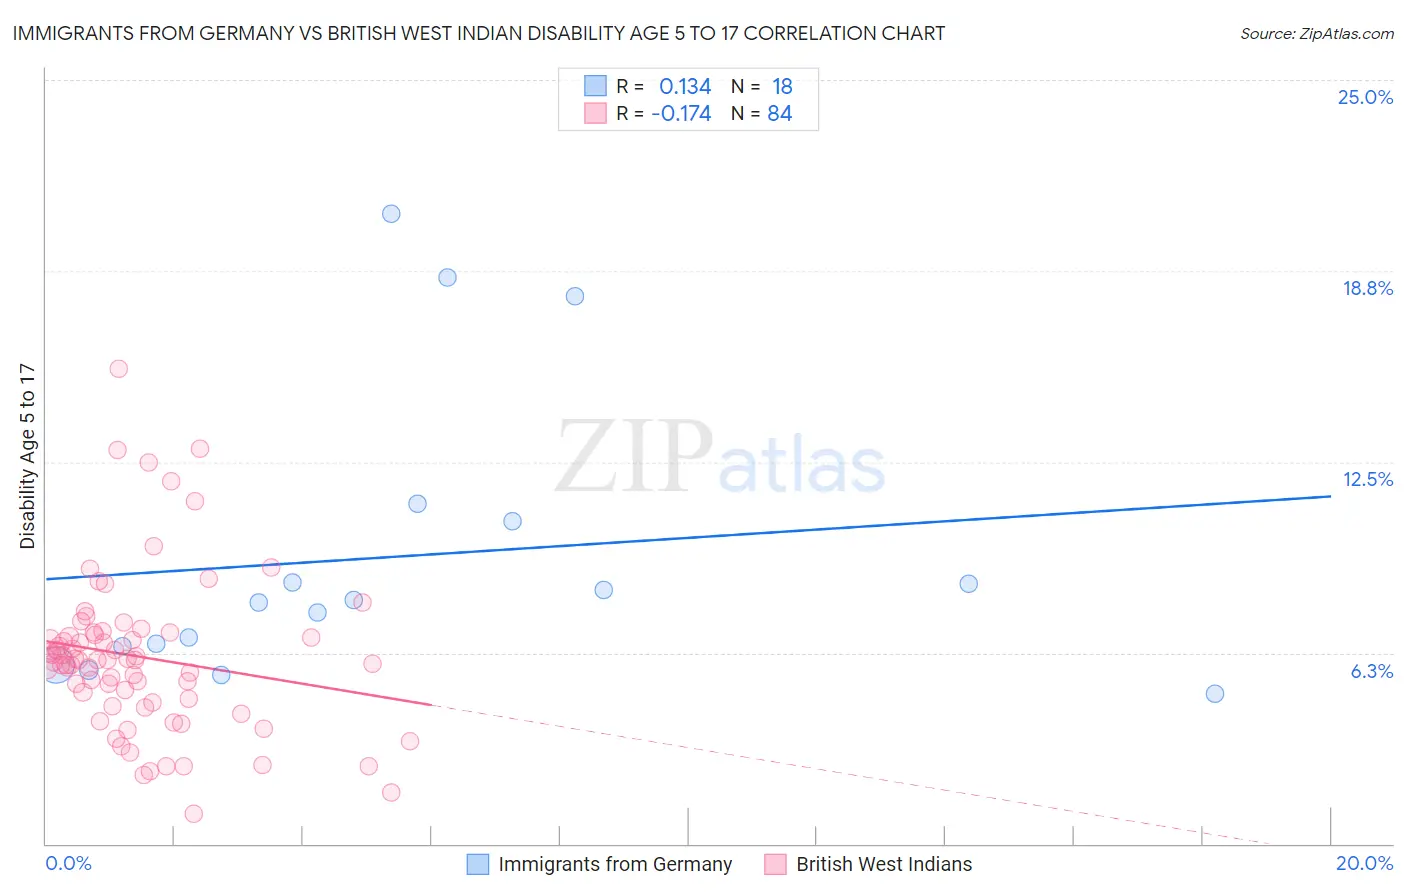
Immigrants from Germany vs British West Indian Disability Age 5 to 17 Correlation Chart
The statistical analysis conducted on geographies consisting of 458,518,539 people shows a poor positive correlation between the proportion of Immigrants from Germany and percentage of population with a disability between the ages 5 and 17 in the United States with a correlation coefficient (R) of 0.134 and weighted average of 5.9%. Similarly, the statistical analysis conducted on geographies consisting of 152,257,483 people shows a poor negative correlation between the proportion of British West Indians and percentage of population with a disability between the ages 5 and 17 in the United States with a correlation coefficient (R) of -0.174 and weighted average of 5.8%, a difference of 1.3%.
Disability Age 5 to 17 Correlation Summary
| Measurement | Immigrants from Germany | British West Indian |
| Minimum | 4.9% | 1.0% |
| Maximum | 20.6% | 15.5% |
| Range | 15.7% | 14.5% |
| Mean | 9.4% | 6.1% |
| Median | 7.9% | 6.0% |
| Interquartile 25% (IQ1) | 6.5% | 4.7% |
| Interquartile 75% (IQ3) | 10.5% | 6.9% |
| Interquartile Range (IQR) | 4.1% | 2.2% |
| Standard Deviation (Sample) | 4.7% | 2.6% |
| Standard Deviation (Population) | 4.6% | 2.6% |
Demographics Similar to Immigrants from Germany and British West Indians by Disability Age 5 to 17
In terms of disability age 5 to 17, the demographic groups most similar to Immigrants from Germany are Immigrants from Micronesia (5.9%, a difference of 0.0%), Indonesian (5.9%, a difference of 0.060%), Spaniard (5.9%, a difference of 0.070%), Immigrants from Caribbean (5.9%, a difference of 0.15%), and West Indian (5.9%, a difference of 0.28%). Similarly, the demographic groups most similar to British West Indians are Guamanian/Chamorro (5.8%, a difference of 0.040%), Swiss (5.8%, a difference of 0.080%), Haitian (5.8%, a difference of 0.16%), Bangladeshi (5.8%, a difference of 0.17%), and Ghanaian (5.8%, a difference of 0.18%).
| Demographics | Rating | Rank | Disability Age 5 to 17 |
| Guamanians/Chamorros | 5.6 /100 | #225 | Tragic 5.8% |
| British West Indians | 5.4 /100 | #226 | Tragic 5.8% |
| Swiss | 5.1 /100 | #227 | Tragic 5.8% |
| Haitians | 4.8 /100 | #228 | Tragic 5.8% |
| Bangladeshis | 4.8 /100 | #229 | Tragic 5.8% |
| Ghanaians | 4.7 /100 | #230 | Tragic 5.8% |
| Europeans | 4.5 /100 | #231 | Tragic 5.8% |
| Immigrants | Laos | 3.8 /100 | #232 | Tragic 5.8% |
| Immigrants | West Indies | 3.5 /100 | #233 | Tragic 5.8% |
| Immigrants | Kenya | 3.4 /100 | #234 | Tragic 5.8% |
| Malaysians | 3.4 /100 | #235 | Tragic 5.8% |
| Immigrants | Brazil | 3.2 /100 | #236 | Tragic 5.8% |
| Sudanese | 2.9 /100 | #237 | Tragic 5.8% |
| Hungarians | 2.6 /100 | #238 | Tragic 5.8% |
| German Russians | 2.4 /100 | #239 | Tragic 5.9% |
| West Indians | 2.4 /100 | #240 | Tragic 5.9% |
| Immigrants | Caribbean | 2.1 /100 | #241 | Tragic 5.9% |
| Spaniards | 2.0 /100 | #242 | Tragic 5.9% |
| Indonesians | 2.0 /100 | #243 | Tragic 5.9% |
| Immigrants | Germany | 1.9 /100 | #244 | Tragic 5.9% |
| Immigrants | Micronesia | 1.9 /100 | #245 | Tragic 5.9% |