Honduran vs British West Indian Master's Degree
COMPARE
Honduran
British West Indian
Master's Degree
Master's Degree Comparison
Hondurans
British West Indians
11.9%
MASTER'S DEGREE
0.2/ 100
METRIC RATING
283rd/ 347
METRIC RANK
13.8%
MASTER'S DEGREE
8.8/ 100
METRIC RATING
229th/ 347
METRIC RANK
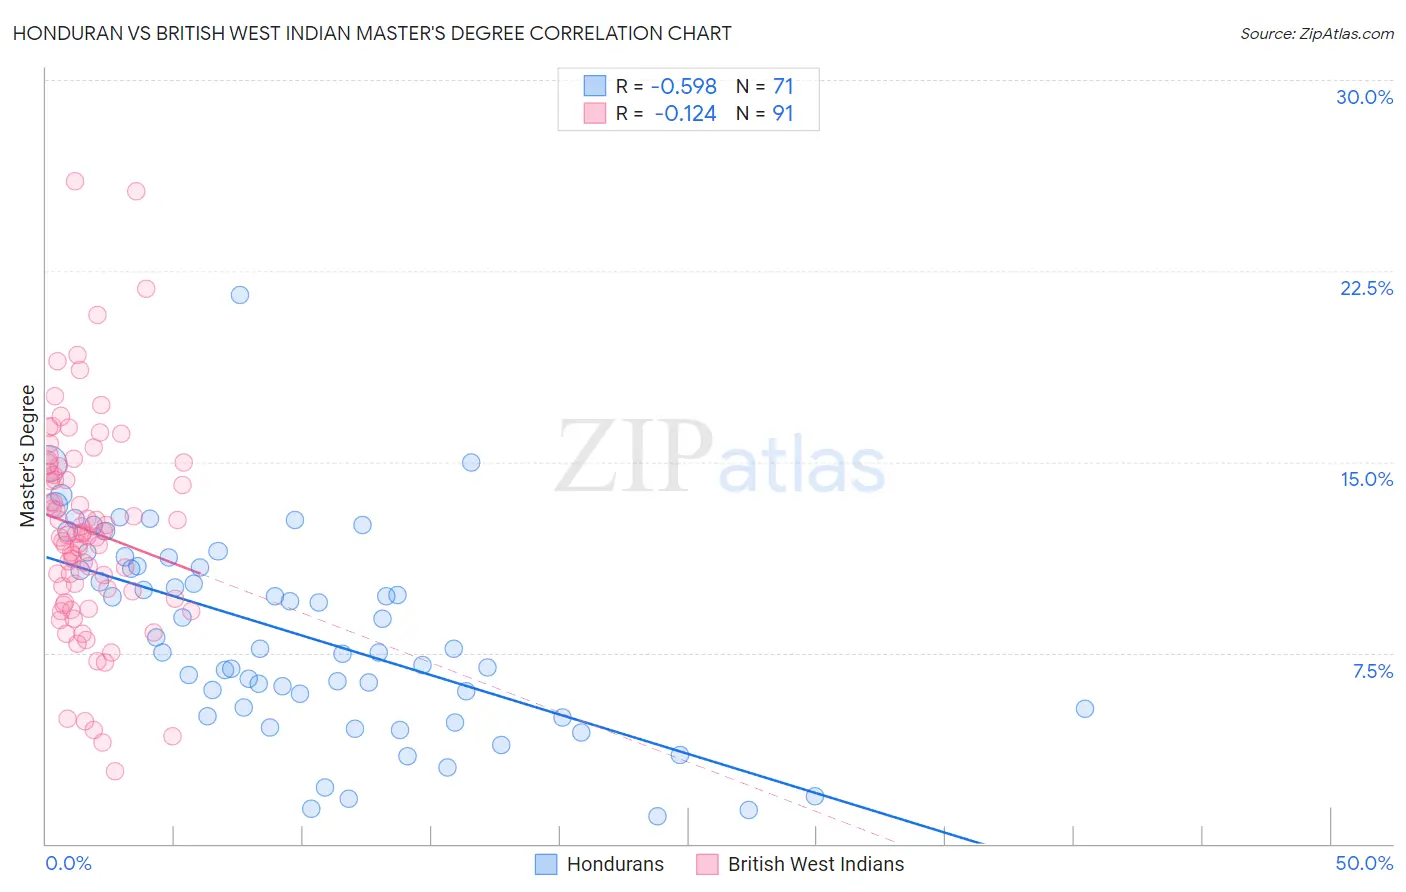
Honduran vs British West Indian Master's Degree Correlation Chart
The statistical analysis conducted on geographies consisting of 357,698,981 people shows a substantial negative correlation between the proportion of Hondurans and percentage of population with at least master's degree education in the United States with a correlation coefficient (R) of -0.598 and weighted average of 11.9%. Similarly, the statistical analysis conducted on geographies consisting of 152,656,458 people shows a poor negative correlation between the proportion of British West Indians and percentage of population with at least master's degree education in the United States with a correlation coefficient (R) of -0.124 and weighted average of 13.8%, a difference of 15.5%.
Master's Degree Correlation Summary
| Measurement | Honduran | British West Indian |
| Minimum | 1.1% | 2.9% |
| Maximum | 21.5% | 26.0% |
| Range | 20.4% | 23.1% |
| Mean | 8.2% | 12.3% |
| Median | 7.6% | 12.2% |
| Interquartile 25% (IQ1) | 5.3% | 9.6% |
| Interquartile 75% (IQ3) | 10.9% | 14.8% |
| Interquartile Range (IQR) | 5.6% | 5.2% |
| Standard Deviation (Sample) | 3.9% | 4.2% |
| Standard Deviation (Population) | 3.9% | 4.2% |
Similar Demographics by Master's Degree
Demographics Similar to Hondurans by Master's Degree
In terms of master's degree, the demographic groups most similar to Hondurans are Immigrants from El Salvador (12.0%, a difference of 0.41%), Malaysian (12.0%, a difference of 0.72%), Ottawa (11.9%, a difference of 0.72%), Immigrants from Dominican Republic (12.1%, a difference of 0.85%), and Immigrants from Belize (12.1%, a difference of 0.90%).
| Demographics | Rating | Rank | Master's Degree |
| Blacks/African Americans | 0.3 /100 | #276 | Tragic 12.1% |
| Immigrants | Caribbean | 0.3 /100 | #277 | Tragic 12.1% |
| Potawatomi | 0.3 /100 | #278 | Tragic 12.1% |
| Immigrants | Belize | 0.2 /100 | #279 | Tragic 12.1% |
| Immigrants | Dominican Republic | 0.2 /100 | #280 | Tragic 12.1% |
| Malaysians | 0.2 /100 | #281 | Tragic 12.0% |
| Immigrants | El Salvador | 0.2 /100 | #282 | Tragic 12.0% |
| Hondurans | 0.2 /100 | #283 | Tragic 11.9% |
| Ottawa | 0.2 /100 | #284 | Tragic 11.9% |
| Immigrants | Nicaragua | 0.2 /100 | #285 | Tragic 11.8% |
| Aleuts | 0.1 /100 | #286 | Tragic 11.8% |
| Immigrants | Haiti | 0.1 /100 | #287 | Tragic 11.8% |
| Immigrants | Honduras | 0.1 /100 | #288 | Tragic 11.8% |
| Guatemalans | 0.1 /100 | #289 | Tragic 11.7% |
| Ute | 0.1 /100 | #290 | Tragic 11.7% |
Demographics Similar to British West Indians by Master's Degree
In terms of master's degree, the demographic groups most similar to British West Indians are Dutch (13.8%, a difference of 0.030%), White/Caucasian (13.8%, a difference of 0.10%), Immigrants from West Indies (13.9%, a difference of 0.42%), Guyanese (13.7%, a difference of 0.58%), and Immigrants from St. Vincent and the Grenadines (13.9%, a difference of 0.86%).
| Demographics | Rating | Rank | Master's Degree |
| Ecuadorians | 12.6 /100 | #222 | Poor 14.0% |
| Immigrants | South Eastern Asia | 11.9 /100 | #223 | Poor 14.0% |
| Immigrants | Grenada | 11.8 /100 | #224 | Poor 14.0% |
| Portuguese | 11.2 /100 | #225 | Poor 13.9% |
| Immigrants | St. Vincent and the Grenadines | 11.0 /100 | #226 | Poor 13.9% |
| Immigrants | West Indies | 9.8 /100 | #227 | Tragic 13.9% |
| Whites/Caucasians | 9.1 /100 | #228 | Tragic 13.8% |
| British West Indians | 8.8 /100 | #229 | Tragic 13.8% |
| Dutch | 8.7 /100 | #230 | Tragic 13.8% |
| Guyanese | 7.6 /100 | #231 | Tragic 13.7% |
| Immigrants | Philippines | 6.0 /100 | #232 | Tragic 13.6% |
| Immigrants | Ecuador | 5.7 /100 | #233 | Tragic 13.6% |
| Immigrants | Burma/Myanmar | 5.0 /100 | #234 | Tragic 13.5% |
| German Russians | 4.5 /100 | #235 | Tragic 13.5% |
| Immigrants | Guyana | 4.4 /100 | #236 | Tragic 13.4% |