Hmong vs Yugoslavian Ambulatory Disability
COMPARE
Hmong
Yugoslavian
Ambulatory Disability
Ambulatory Disability Comparison
Hmong
Yugoslavians
6.6%
AMBULATORY DISABILITY
0.3/ 100
METRIC RATING
263rd/ 347
METRIC RANK
6.3%
AMBULATORY DISABILITY
10.9/ 100
METRIC RATING
217th/ 347
METRIC RANK
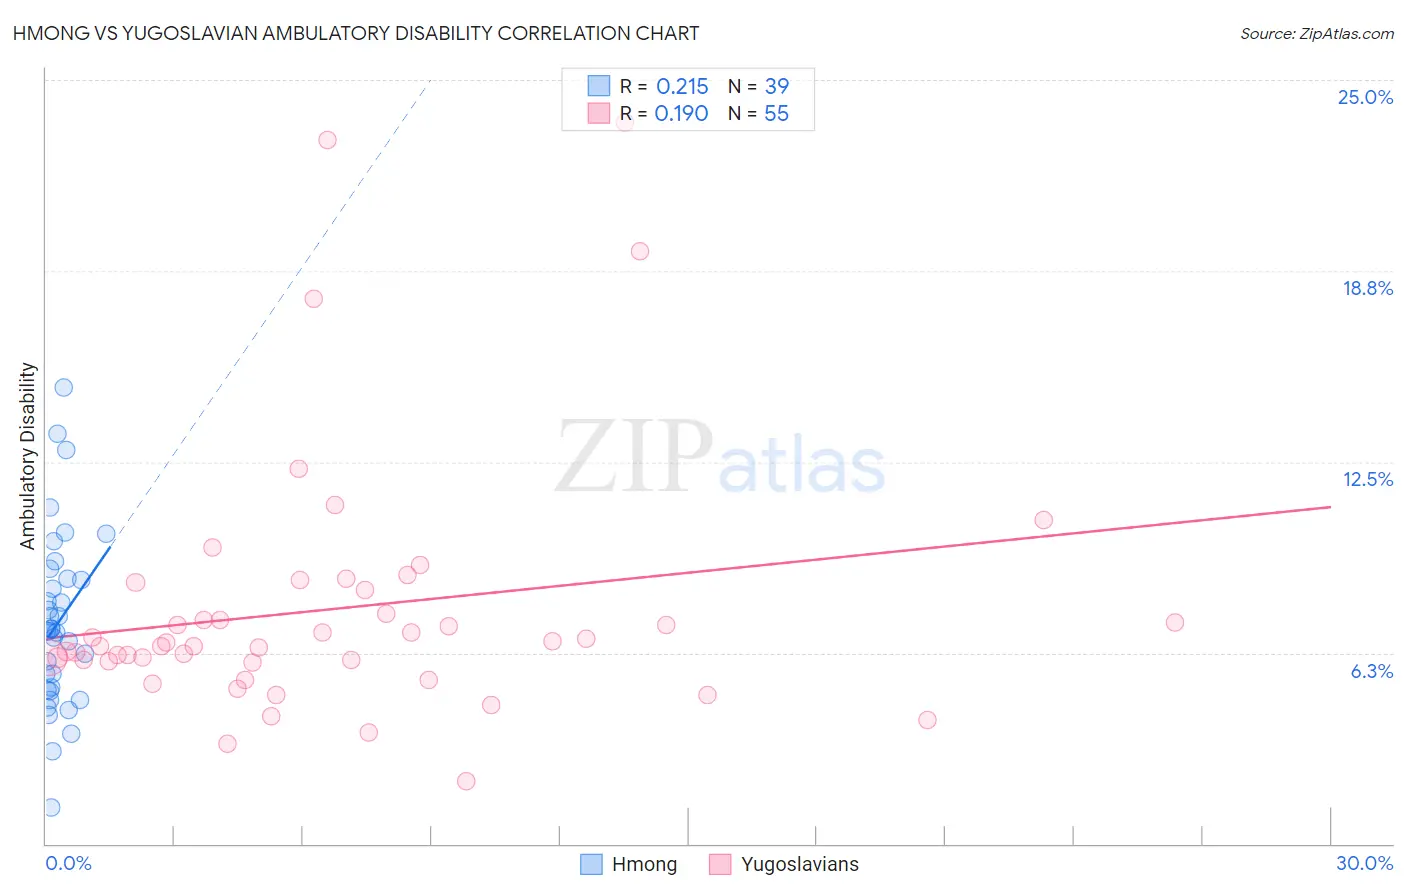
Hmong vs Yugoslavian Ambulatory Disability Correlation Chart
The statistical analysis conducted on geographies consisting of 24,680,511 people shows a weak positive correlation between the proportion of Hmong and percentage of population with ambulatory disability in the United States with a correlation coefficient (R) of 0.215 and weighted average of 6.6%. Similarly, the statistical analysis conducted on geographies consisting of 285,658,107 people shows a poor positive correlation between the proportion of Yugoslavians and percentage of population with ambulatory disability in the United States with a correlation coefficient (R) of 0.190 and weighted average of 6.3%, a difference of 4.6%.
Ambulatory Disability Correlation Summary
| Measurement | Hmong | Yugoslavian |
| Minimum | 1.2% | 2.0% |
| Maximum | 14.9% | 23.6% |
| Range | 13.7% | 21.6% |
| Mean | 7.2% | 7.7% |
| Median | 7.0% | 6.5% |
| Interquartile 25% (IQ1) | 5.0% | 6.0% |
| Interquartile 75% (IQ3) | 8.7% | 8.3% |
| Interquartile Range (IQR) | 3.7% | 2.3% |
| Standard Deviation (Sample) | 2.9% | 4.2% |
| Standard Deviation (Population) | 2.8% | 4.2% |
Similar Demographics by Ambulatory Disability
Demographics Similar to Hmong by Ambulatory Disability
In terms of ambulatory disability, the demographic groups most similar to Hmong are English (6.6%, a difference of 0.12%), Irish (6.6%, a difference of 0.29%), Immigrants from Belize (6.6%, a difference of 0.36%), Aleut (6.6%, a difference of 0.37%), and Nepalese (6.6%, a difference of 0.40%).
| Demographics | Rating | Rank | Ambulatory Disability |
| Immigrants | Uzbekistan | 0.6 /100 | #256 | Tragic 6.5% |
| Bermudans | 0.5 /100 | #257 | Tragic 6.5% |
| Spanish American Indians | 0.5 /100 | #258 | Tragic 6.5% |
| Aleuts | 0.4 /100 | #259 | Tragic 6.6% |
| Immigrants | Belize | 0.4 /100 | #260 | Tragic 6.6% |
| Irish | 0.4 /100 | #261 | Tragic 6.6% |
| English | 0.4 /100 | #262 | Tragic 6.6% |
| Hmong | 0.3 /100 | #263 | Tragic 6.6% |
| Nepalese | 0.2 /100 | #264 | Tragic 6.6% |
| Bahamians | 0.2 /100 | #265 | Tragic 6.6% |
| Guyanese | 0.2 /100 | #266 | Tragic 6.6% |
| Trinidadians and Tobagonians | 0.2 /100 | #267 | Tragic 6.6% |
| Spanish | 0.2 /100 | #268 | Tragic 6.6% |
| French | 0.1 /100 | #269 | Tragic 6.6% |
| Slovaks | 0.1 /100 | #270 | Tragic 6.7% |
Demographics Similar to Yugoslavians by Ambulatory Disability
In terms of ambulatory disability, the demographic groups most similar to Yugoslavians are Canadian (6.3%, a difference of 0.0%), Immigrants from Latin America (6.3%, a difference of 0.010%), Immigrants from Mexico (6.3%, a difference of 0.020%), Guamanian/Chamorro (6.3%, a difference of 0.040%), and Mexican American Indian (6.3%, a difference of 0.14%).
| Demographics | Rating | Rank | Ambulatory Disability |
| Immigrants | Laos | 13.2 /100 | #210 | Poor 6.3% |
| Samoans | 12.1 /100 | #211 | Poor 6.3% |
| Mexican American Indians | 12.0 /100 | #212 | Poor 6.3% |
| Japanese | 12.0 /100 | #213 | Poor 6.3% |
| Immigrants | Mexico | 11.0 /100 | #214 | Poor 6.3% |
| Immigrants | Latin America | 11.0 /100 | #215 | Poor 6.3% |
| Canadians | 10.9 /100 | #216 | Poor 6.3% |
| Yugoslavians | 10.9 /100 | #217 | Poor 6.3% |
| Guamanians/Chamorros | 10.6 /100 | #218 | Poor 6.3% |
| Indonesians | 9.9 /100 | #219 | Tragic 6.3% |
| Immigrants | Albania | 9.6 /100 | #220 | Tragic 6.3% |
| Hungarians | 9.6 /100 | #221 | Tragic 6.3% |
| German Russians | 9.4 /100 | #222 | Tragic 6.3% |
| Immigrants | Honduras | 7.6 /100 | #223 | Tragic 6.3% |
| Liberians | 7.1 /100 | #224 | Tragic 6.3% |