Hmong vs Immigrants from Western Africa Ambulatory Disability
COMPARE
Hmong
Immigrants from Western Africa
Ambulatory Disability
Ambulatory Disability Comparison
Hmong
Immigrants from Western Africa
6.6%
AMBULATORY DISABILITY
0.3/ 100
METRIC RATING
263rd/ 347
METRIC RANK
6.2%
AMBULATORY DISABILITY
33.4/ 100
METRIC RATING
190th/ 347
METRIC RANK
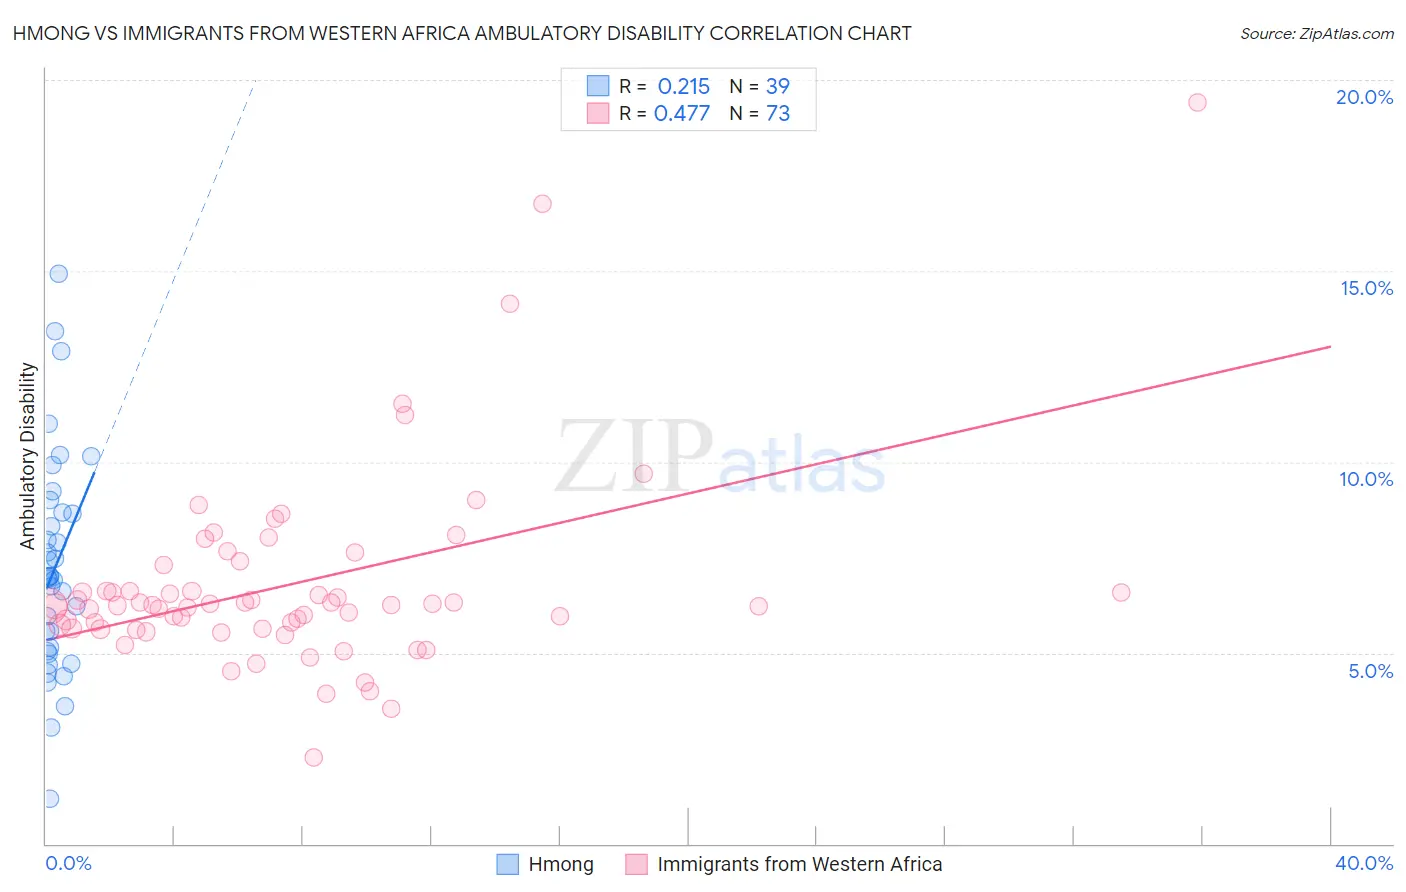
Hmong vs Immigrants from Western Africa Ambulatory Disability Correlation Chart
The statistical analysis conducted on geographies consisting of 24,680,511 people shows a weak positive correlation between the proportion of Hmong and percentage of population with ambulatory disability in the United States with a correlation coefficient (R) of 0.215 and weighted average of 6.6%. Similarly, the statistical analysis conducted on geographies consisting of 357,681,039 people shows a moderate positive correlation between the proportion of Immigrants from Western Africa and percentage of population with ambulatory disability in the United States with a correlation coefficient (R) of 0.477 and weighted average of 6.2%, a difference of 6.6%.
Ambulatory Disability Correlation Summary
| Measurement | Hmong | Immigrants from Western Africa |
| Minimum | 1.2% | 2.3% |
| Maximum | 14.9% | 19.4% |
| Range | 13.7% | 17.2% |
| Mean | 7.2% | 6.8% |
| Median | 7.0% | 6.2% |
| Interquartile 25% (IQ1) | 5.0% | 5.6% |
| Interquartile 75% (IQ3) | 8.7% | 7.0% |
| Interquartile Range (IQR) | 3.7% | 1.3% |
| Standard Deviation (Sample) | 2.9% | 2.6% |
| Standard Deviation (Population) | 2.8% | 2.6% |
Similar Demographics by Ambulatory Disability
Demographics Similar to Hmong by Ambulatory Disability
In terms of ambulatory disability, the demographic groups most similar to Hmong are English (6.6%, a difference of 0.12%), Irish (6.6%, a difference of 0.29%), Immigrants from Belize (6.6%, a difference of 0.36%), Aleut (6.6%, a difference of 0.37%), and Nepalese (6.6%, a difference of 0.40%).
| Demographics | Rating | Rank | Ambulatory Disability |
| Immigrants | Uzbekistan | 0.6 /100 | #256 | Tragic 6.5% |
| Bermudans | 0.5 /100 | #257 | Tragic 6.5% |
| Spanish American Indians | 0.5 /100 | #258 | Tragic 6.5% |
| Aleuts | 0.4 /100 | #259 | Tragic 6.6% |
| Immigrants | Belize | 0.4 /100 | #260 | Tragic 6.6% |
| Irish | 0.4 /100 | #261 | Tragic 6.6% |
| English | 0.4 /100 | #262 | Tragic 6.6% |
| Hmong | 0.3 /100 | #263 | Tragic 6.6% |
| Nepalese | 0.2 /100 | #264 | Tragic 6.6% |
| Bahamians | 0.2 /100 | #265 | Tragic 6.6% |
| Guyanese | 0.2 /100 | #266 | Tragic 6.6% |
| Trinidadians and Tobagonians | 0.2 /100 | #267 | Tragic 6.6% |
| Spanish | 0.2 /100 | #268 | Tragic 6.6% |
| French | 0.1 /100 | #269 | Tragic 6.6% |
| Slovaks | 0.1 /100 | #270 | Tragic 6.7% |
Demographics Similar to Immigrants from Western Africa by Ambulatory Disability
In terms of ambulatory disability, the demographic groups most similar to Immigrants from Western Africa are Ukrainian (6.2%, a difference of 0.040%), British (6.2%, a difference of 0.050%), Immigrants from Guatemala (6.2%, a difference of 0.090%), Immigrants from Western Europe (6.2%, a difference of 0.10%), and Carpatho Rusyn (6.2%, a difference of 0.12%).
| Demographics | Rating | Rank | Ambulatory Disability |
| Immigrants | Thailand | 42.2 /100 | #183 | Average 6.1% |
| Immigrants | Ghana | 41.2 /100 | #184 | Average 6.1% |
| Immigrants | Bosnia and Herzegovina | 37.2 /100 | #185 | Fair 6.2% |
| Europeans | 36.2 /100 | #186 | Fair 6.2% |
| Carpatho Rusyns | 35.3 /100 | #187 | Fair 6.2% |
| British | 34.3 /100 | #188 | Fair 6.2% |
| Ukrainians | 34.0 /100 | #189 | Fair 6.2% |
| Immigrants | Western Africa | 33.4 /100 | #190 | Fair 6.2% |
| Immigrants | Guatemala | 31.9 /100 | #191 | Fair 6.2% |
| Immigrants | Western Europe | 31.6 /100 | #192 | Fair 6.2% |
| Guatemalans | 30.0 /100 | #193 | Fair 6.2% |
| Alaska Natives | 29.8 /100 | #194 | Fair 6.2% |
| Belgians | 28.6 /100 | #195 | Fair 6.2% |
| Malaysians | 28.2 /100 | #196 | Fair 6.2% |
| Poles | 26.3 /100 | #197 | Fair 6.2% |