Hmong vs Nigerian Ambulatory Disability
COMPARE
Hmong
Nigerian
Ambulatory Disability
Ambulatory Disability Comparison
Hmong
Nigerians
6.6%
AMBULATORY DISABILITY
0.3/ 100
METRIC RATING
263rd/ 347
METRIC RANK
6.1%
AMBULATORY DISABILITY
67.1/ 100
METRIC RATING
162nd/ 347
METRIC RANK
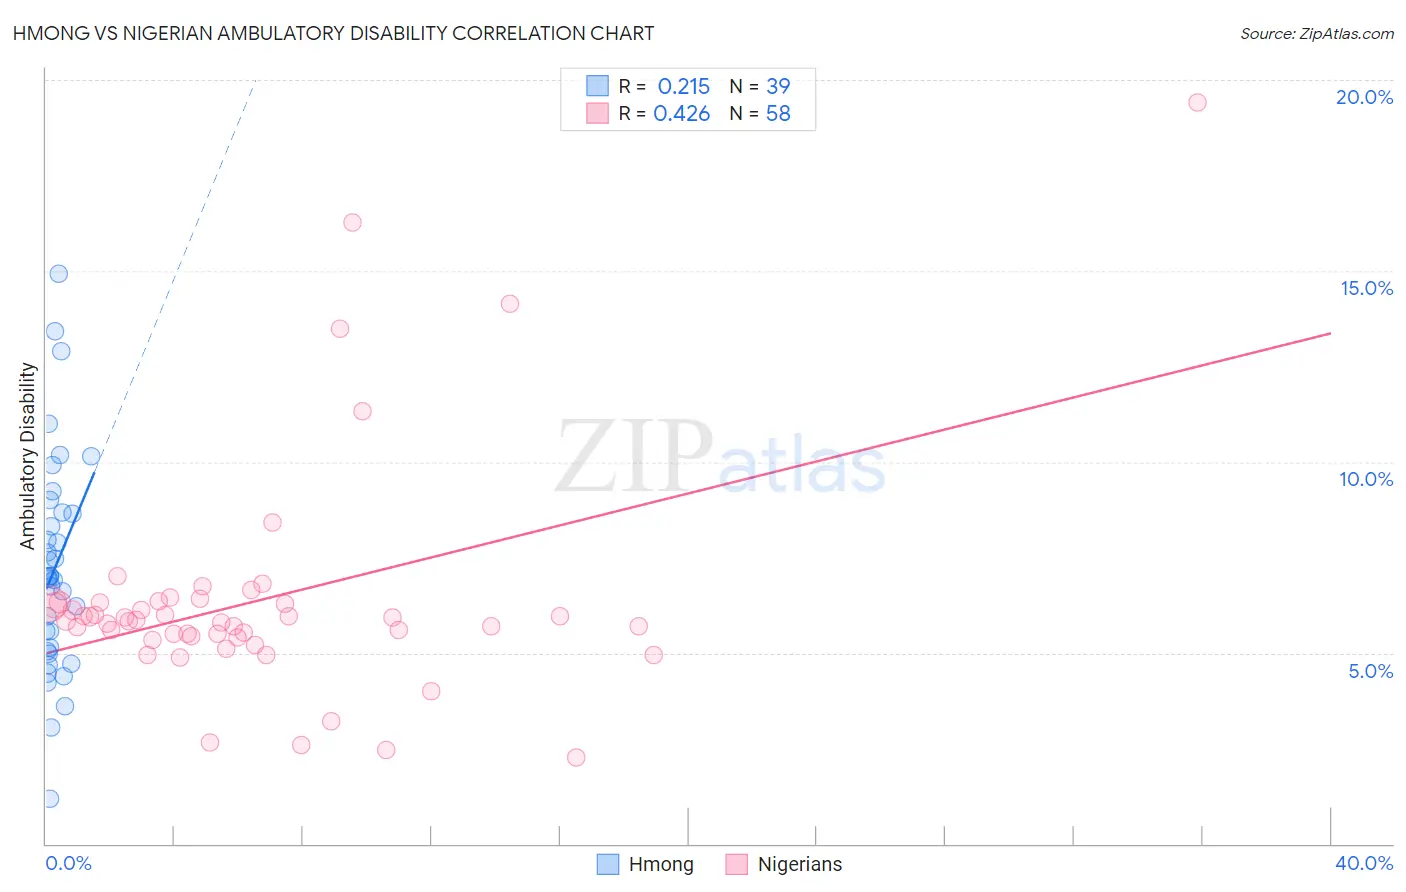
Hmong vs Nigerian Ambulatory Disability Correlation Chart
The statistical analysis conducted on geographies consisting of 24,680,511 people shows a weak positive correlation between the proportion of Hmong and percentage of population with ambulatory disability in the United States with a correlation coefficient (R) of 0.215 and weighted average of 6.6%. Similarly, the statistical analysis conducted on geographies consisting of 332,639,431 people shows a moderate positive correlation between the proportion of Nigerians and percentage of population with ambulatory disability in the United States with a correlation coefficient (R) of 0.426 and weighted average of 6.1%, a difference of 8.6%.
Ambulatory Disability Correlation Summary
| Measurement | Hmong | Nigerian |
| Minimum | 1.2% | 2.2% |
| Maximum | 14.9% | 19.4% |
| Range | 13.7% | 17.2% |
| Mean | 7.2% | 6.4% |
| Median | 7.0% | 5.9% |
| Interquartile 25% (IQ1) | 5.0% | 5.4% |
| Interquartile 75% (IQ3) | 8.7% | 6.3% |
| Interquartile Range (IQR) | 3.7% | 0.90% |
| Standard Deviation (Sample) | 2.9% | 3.0% |
| Standard Deviation (Population) | 2.8% | 3.0% |
Similar Demographics by Ambulatory Disability
Demographics Similar to Hmong by Ambulatory Disability
In terms of ambulatory disability, the demographic groups most similar to Hmong are English (6.6%, a difference of 0.12%), Irish (6.6%, a difference of 0.29%), Immigrants from Belize (6.6%, a difference of 0.36%), Aleut (6.6%, a difference of 0.37%), and Nepalese (6.6%, a difference of 0.40%).
| Demographics | Rating | Rank | Ambulatory Disability |
| Immigrants | Uzbekistan | 0.6 /100 | #256 | Tragic 6.5% |
| Bermudans | 0.5 /100 | #257 | Tragic 6.5% |
| Spanish American Indians | 0.5 /100 | #258 | Tragic 6.5% |
| Aleuts | 0.4 /100 | #259 | Tragic 6.6% |
| Immigrants | Belize | 0.4 /100 | #260 | Tragic 6.6% |
| Irish | 0.4 /100 | #261 | Tragic 6.6% |
| English | 0.4 /100 | #262 | Tragic 6.6% |
| Hmong | 0.3 /100 | #263 | Tragic 6.6% |
| Nepalese | 0.2 /100 | #264 | Tragic 6.6% |
| Bahamians | 0.2 /100 | #265 | Tragic 6.6% |
| Guyanese | 0.2 /100 | #266 | Tragic 6.6% |
| Trinidadians and Tobagonians | 0.2 /100 | #267 | Tragic 6.6% |
| Spanish | 0.2 /100 | #268 | Tragic 6.6% |
| French | 0.1 /100 | #269 | Tragic 6.6% |
| Slovaks | 0.1 /100 | #270 | Tragic 6.7% |
Demographics Similar to Nigerians by Ambulatory Disability
In terms of ambulatory disability, the demographic groups most similar to Nigerians are Lebanese (6.1%, a difference of 0.050%), Immigrants from Belarus (6.1%, a difference of 0.13%), Central American (6.0%, a difference of 0.17%), Basque (6.1%, a difference of 0.20%), and Nicaraguan (6.1%, a difference of 0.23%).
| Demographics | Rating | Rank | Ambulatory Disability |
| Immigrants | Scotland | 72.1 /100 | #155 | Good 6.0% |
| Northern Europeans | 71.8 /100 | #156 | Good 6.0% |
| Ghanaians | 71.3 /100 | #157 | Good 6.0% |
| Immigrants | Fiji | 71.2 /100 | #158 | Good 6.0% |
| Immigrants | Latvia | 71.1 /100 | #159 | Good 6.0% |
| Central Americans | 69.8 /100 | #160 | Good 6.0% |
| Immigrants | Belarus | 69.2 /100 | #161 | Good 6.1% |
| Nigerians | 67.1 /100 | #162 | Good 6.1% |
| Lebanese | 66.2 /100 | #163 | Good 6.1% |
| Basques | 63.7 /100 | #164 | Good 6.1% |
| Nicaraguans | 63.2 /100 | #165 | Good 6.1% |
| Iraqis | 62.8 /100 | #166 | Good 6.1% |
| Immigrants | Oceania | 60.7 /100 | #167 | Good 6.1% |
| Ecuadorians | 60.5 /100 | #168 | Good 6.1% |
| Immigrants | Southern Europe | 58.1 /100 | #169 | Average 6.1% |