Hmong vs Alaskan Athabascan Ambulatory Disability
COMPARE
Hmong
Alaskan Athabascan
Ambulatory Disability
Ambulatory Disability Comparison
Hmong
Alaskan Athabascans
6.6%
AMBULATORY DISABILITY
0.3/ 100
METRIC RATING
263rd/ 347
METRIC RANK
6.9%
AMBULATORY DISABILITY
0.0/ 100
METRIC RATING
296th/ 347
METRIC RANK
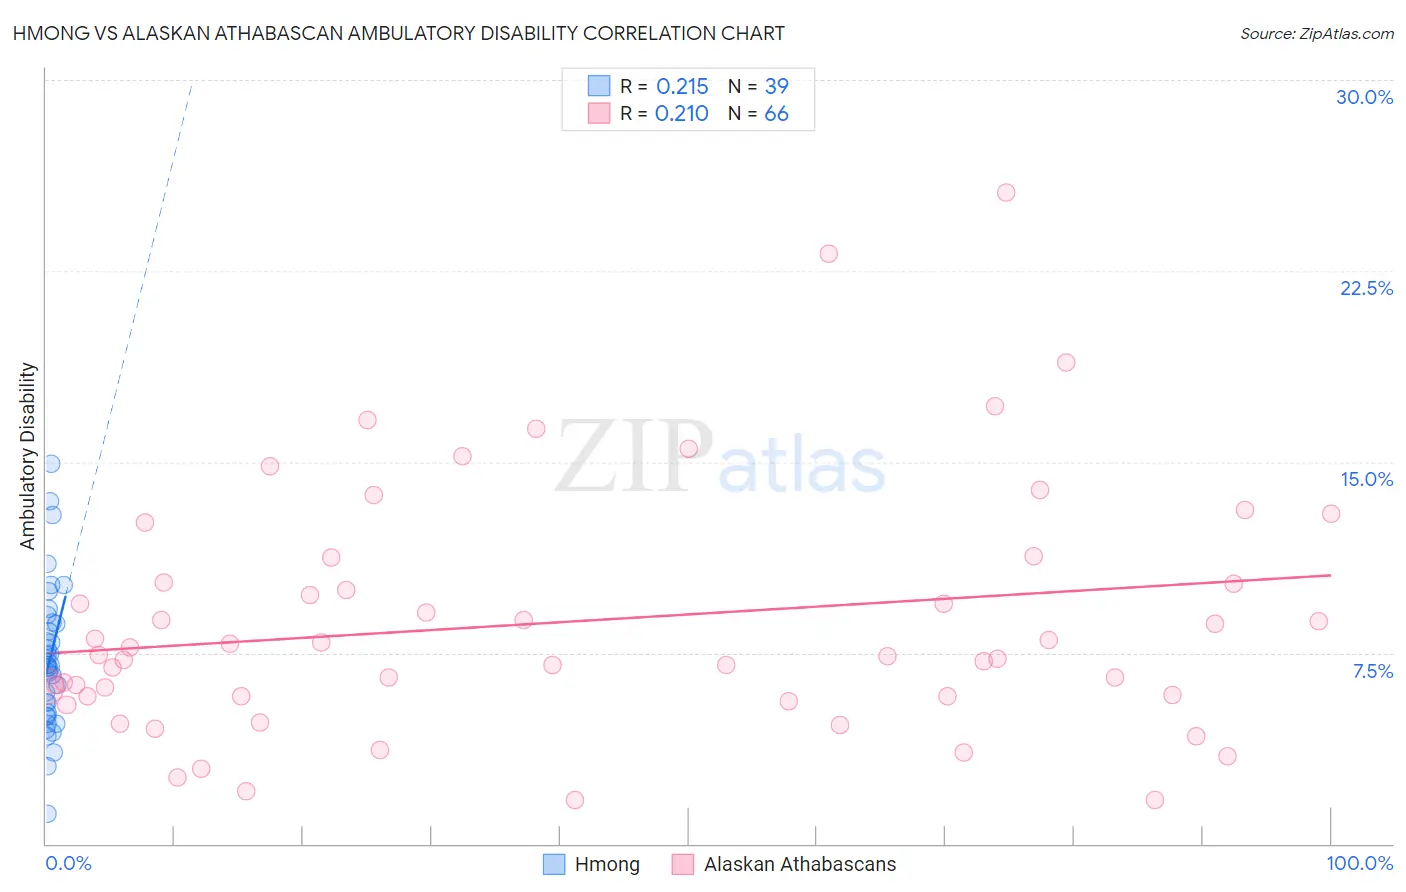
Hmong vs Alaskan Athabascan Ambulatory Disability Correlation Chart
The statistical analysis conducted on geographies consisting of 24,680,511 people shows a weak positive correlation between the proportion of Hmong and percentage of population with ambulatory disability in the United States with a correlation coefficient (R) of 0.215 and weighted average of 6.6%. Similarly, the statistical analysis conducted on geographies consisting of 45,819,153 people shows a weak positive correlation between the proportion of Alaskan Athabascans and percentage of population with ambulatory disability in the United States with a correlation coefficient (R) of 0.210 and weighted average of 6.9%, a difference of 5.2%.
Ambulatory Disability Correlation Summary
| Measurement | Hmong | Alaskan Athabascan |
| Minimum | 1.2% | 1.7% |
| Maximum | 14.9% | 25.6% |
| Range | 13.7% | 23.9% |
| Mean | 7.2% | 8.7% |
| Median | 7.0% | 7.4% |
| Interquartile 25% (IQ1) | 5.0% | 5.8% |
| Interquartile 75% (IQ3) | 8.7% | 10.3% |
| Interquartile Range (IQR) | 3.7% | 4.5% |
| Standard Deviation (Sample) | 2.9% | 4.9% |
| Standard Deviation (Population) | 2.8% | 4.8% |
Similar Demographics by Ambulatory Disability
Demographics Similar to Hmong by Ambulatory Disability
In terms of ambulatory disability, the demographic groups most similar to Hmong are English (6.6%, a difference of 0.12%), Irish (6.6%, a difference of 0.29%), Immigrants from Belize (6.6%, a difference of 0.36%), Aleut (6.6%, a difference of 0.37%), and Nepalese (6.6%, a difference of 0.40%).
| Demographics | Rating | Rank | Ambulatory Disability |
| Immigrants | Uzbekistan | 0.6 /100 | #256 | Tragic 6.5% |
| Bermudans | 0.5 /100 | #257 | Tragic 6.5% |
| Spanish American Indians | 0.5 /100 | #258 | Tragic 6.5% |
| Aleuts | 0.4 /100 | #259 | Tragic 6.6% |
| Immigrants | Belize | 0.4 /100 | #260 | Tragic 6.6% |
| Irish | 0.4 /100 | #261 | Tragic 6.6% |
| English | 0.4 /100 | #262 | Tragic 6.6% |
| Hmong | 0.3 /100 | #263 | Tragic 6.6% |
| Nepalese | 0.2 /100 | #264 | Tragic 6.6% |
| Bahamians | 0.2 /100 | #265 | Tragic 6.6% |
| Guyanese | 0.2 /100 | #266 | Tragic 6.6% |
| Trinidadians and Tobagonians | 0.2 /100 | #267 | Tragic 6.6% |
| Spanish | 0.2 /100 | #268 | Tragic 6.6% |
| French | 0.1 /100 | #269 | Tragic 6.6% |
| Slovaks | 0.1 /100 | #270 | Tragic 6.7% |
Demographics Similar to Alaskan Athabascans by Ambulatory Disability
In terms of ambulatory disability, the demographic groups most similar to Alaskan Athabascans are French American Indian (6.9%, a difference of 0.17%), Immigrants from Grenada (6.9%, a difference of 0.18%), Crow (6.9%, a difference of 0.23%), Cape Verdean (6.9%, a difference of 0.30%), and Puget Sound Salish (6.9%, a difference of 0.31%).
| Demographics | Rating | Rank | Ambulatory Disability |
| Immigrants | Dominica | 0.0 /100 | #289 | Tragic 6.9% |
| Scotch-Irish | 0.0 /100 | #290 | Tragic 6.9% |
| West Indians | 0.0 /100 | #291 | Tragic 6.9% |
| Cheyenne | 0.0 /100 | #292 | Tragic 6.9% |
| Immigrants | St. Vincent and the Grenadines | 0.0 /100 | #293 | Tragic 6.9% |
| Cape Verdeans | 0.0 /100 | #294 | Tragic 6.9% |
| Crow | 0.0 /100 | #295 | Tragic 6.9% |
| Alaskan Athabascans | 0.0 /100 | #296 | Tragic 6.9% |
| French American Indians | 0.0 /100 | #297 | Tragic 6.9% |
| Immigrants | Grenada | 0.0 /100 | #298 | Tragic 6.9% |
| Puget Sound Salish | 0.0 /100 | #299 | Tragic 6.9% |
| Marshallese | 0.0 /100 | #300 | Tragic 6.9% |
| British West Indians | 0.0 /100 | #301 | Tragic 7.0% |
| Immigrants | Armenia | 0.0 /100 | #302 | Tragic 7.0% |
| Africans | 0.0 /100 | #303 | Tragic 7.0% |