Hispanic or Latino vs Laotian Hearing Disability
COMPARE
Hispanic or Latino
Laotian
Hearing Disability
Hearing Disability Comparison
Hispanics or Latinos
Laotians
3.1%
HEARING DISABILITY
15.1/ 100
METRIC RATING
207th/ 347
METRIC RANK
2.9%
HEARING DISABILITY
81.1/ 100
METRIC RATING
142nd/ 347
METRIC RANK
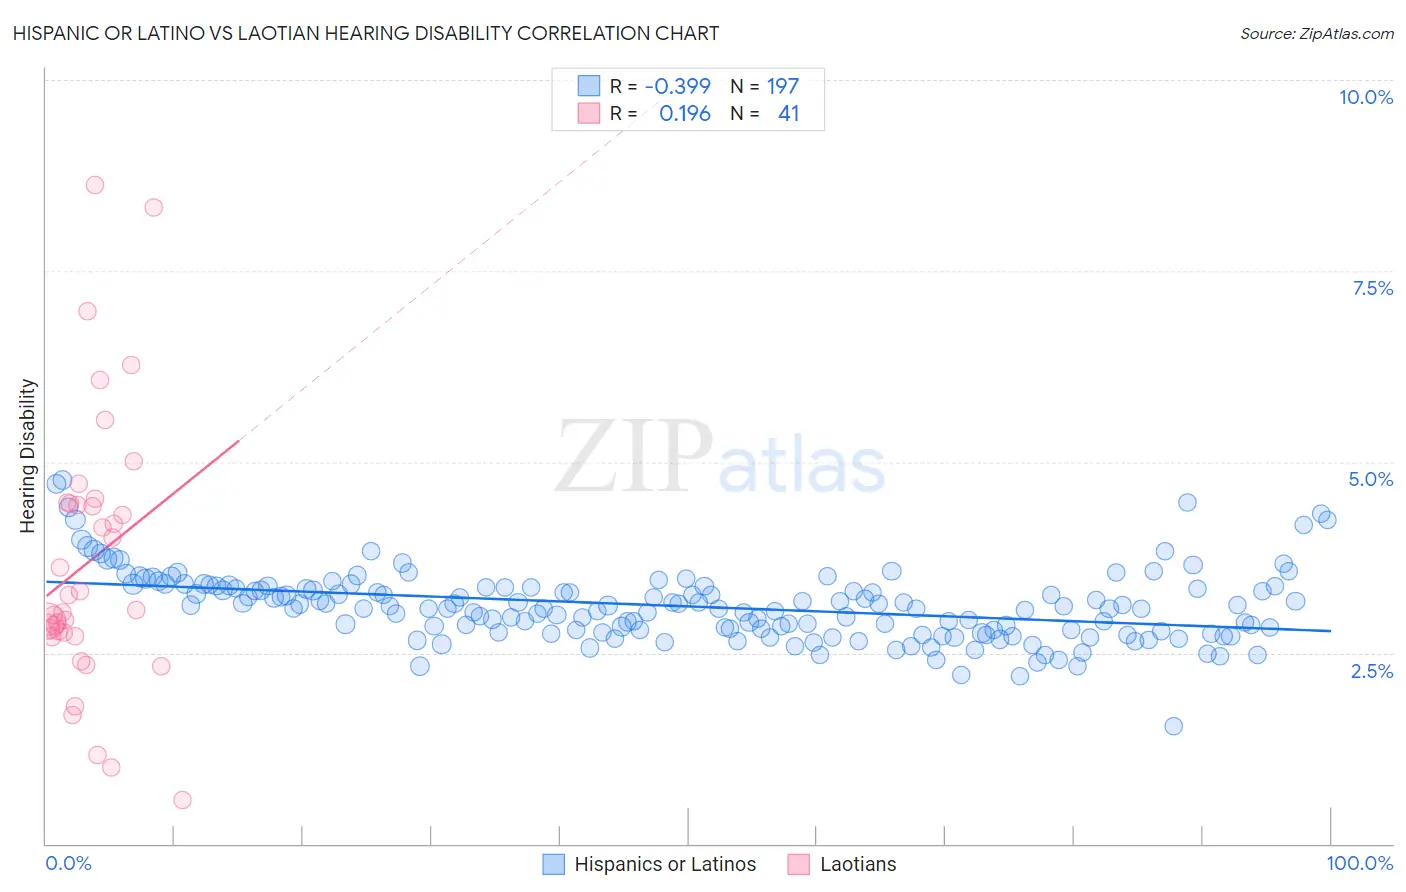
Hispanic or Latino vs Laotian Hearing Disability Correlation Chart
The statistical analysis conducted on geographies consisting of 570,237,836 people shows a mild negative correlation between the proportion of Hispanics or Latinos and percentage of population with hearing disability in the United States with a correlation coefficient (R) of -0.399 and weighted average of 3.1%. Similarly, the statistical analysis conducted on geographies consisting of 224,832,654 people shows a poor positive correlation between the proportion of Laotians and percentage of population with hearing disability in the United States with a correlation coefficient (R) of 0.196 and weighted average of 2.9%, a difference of 7.7%.
Hearing Disability Correlation Summary
| Measurement | Hispanic or Latino | Laotian |
| Minimum | 1.5% | 0.57% |
| Maximum | 4.8% | 8.6% |
| Range | 3.2% | 8.0% |
| Mean | 3.1% | 3.7% |
| Median | 3.1% | 3.1% |
| Interquartile 25% (IQ1) | 2.8% | 2.7% |
| Interquartile 75% (IQ3) | 3.4% | 4.5% |
| Interquartile Range (IQR) | 0.57% | 1.7% |
| Standard Deviation (Sample) | 0.46% | 1.8% |
| Standard Deviation (Population) | 0.46% | 1.7% |
Similar Demographics by Hearing Disability
Demographics Similar to Hispanics or Latinos by Hearing Disability
In terms of hearing disability, the demographic groups most similar to Hispanics or Latinos are Eastern European (3.1%, a difference of 0.070%), Immigrants from Czechoslovakia (3.1%, a difference of 0.13%), Alsatian (3.1%, a difference of 0.13%), Immigrants from Denmark (3.1%, a difference of 0.18%), and Immigrants from Thailand (3.1%, a difference of 0.22%).
| Demographics | Rating | Rank | Hearing Disability |
| Immigrants | North Macedonia | 19.1 /100 | #200 | Poor 3.1% |
| Iraqis | 19.0 /100 | #201 | Poor 3.1% |
| Immigrants | Thailand | 16.4 /100 | #202 | Poor 3.1% |
| Immigrants | Denmark | 16.2 /100 | #203 | Poor 3.1% |
| Immigrants | Czechoslovakia | 15.9 /100 | #204 | Poor 3.1% |
| Alsatians | 15.9 /100 | #205 | Poor 3.1% |
| Eastern Europeans | 15.5 /100 | #206 | Poor 3.1% |
| Hispanics or Latinos | 15.1 /100 | #207 | Poor 3.1% |
| Immigrants | Latvia | 12.7 /100 | #208 | Poor 3.1% |
| Immigrants | Hungary | 12.5 /100 | #209 | Poor 3.1% |
| Cape Verdeans | 12.2 /100 | #210 | Poor 3.1% |
| Romanians | 12.1 /100 | #211 | Poor 3.1% |
| Pakistanis | 11.1 /100 | #212 | Poor 3.1% |
| Immigrants | Iraq | 10.5 /100 | #213 | Poor 3.1% |
| Australians | 8.1 /100 | #214 | Tragic 3.2% |
Demographics Similar to Laotians by Hearing Disability
In terms of hearing disability, the demographic groups most similar to Laotians are Immigrants from Bahamas (2.9%, a difference of 0.020%), Immigrants from Bulgaria (2.9%, a difference of 0.29%), Immigrants from Congo (2.9%, a difference of 0.34%), Brazilian (2.9%, a difference of 0.36%), and Subsaharan African (2.9%, a difference of 0.37%).
| Demographics | Rating | Rank | Hearing Disability |
| Soviet Union | 84.8 /100 | #135 | Excellent 2.9% |
| Immigrants | Brazil | 84.6 /100 | #136 | Excellent 2.9% |
| Sri Lankans | 84.1 /100 | #137 | Excellent 2.9% |
| Immigrants | Costa Rica | 84.0 /100 | #138 | Excellent 2.9% |
| Bermudans | 83.8 /100 | #139 | Excellent 2.9% |
| Immigrants | Jordan | 83.7 /100 | #140 | Excellent 2.9% |
| Sub-Saharan Africans | 83.3 /100 | #141 | Excellent 2.9% |
| Laotians | 81.1 /100 | #142 | Excellent 2.9% |
| Immigrants | Bahamas | 80.9 /100 | #143 | Excellent 2.9% |
| Immigrants | Bulgaria | 79.2 /100 | #144 | Good 2.9% |
| Immigrants | Congo | 78.9 /100 | #145 | Good 2.9% |
| Brazilians | 78.7 /100 | #146 | Good 2.9% |
| Tongans | 78.6 /100 | #147 | Good 2.9% |
| Immigrants | Russia | 77.7 /100 | #148 | Good 2.9% |
| Immigrants | Panama | 76.9 /100 | #149 | Good 2.9% |