Hispanic or Latino vs Laotian 3rd Grade
COMPARE
Hispanic or Latino
Laotian
3rd Grade
3rd Grade Comparison
Hispanics or Latinos
Laotians
96.5%
3RD GRADE
0.0/ 100
METRIC RATING
318th/ 347
METRIC RANK
97.6%
3RD GRADE
9.4/ 100
METRIC RATING
211th/ 347
METRIC RANK
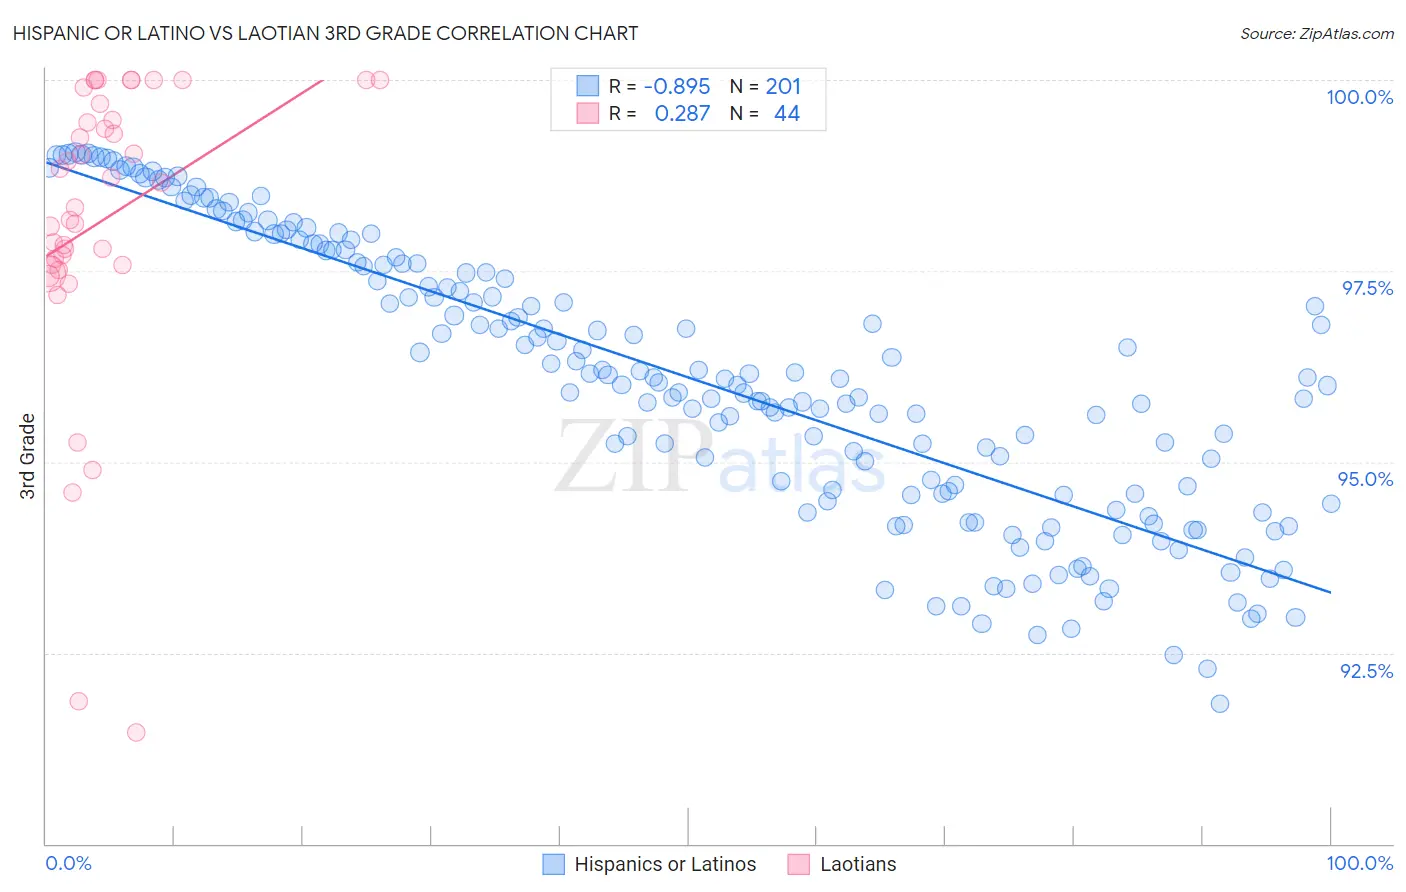
Hispanic or Latino vs Laotian 3rd Grade Correlation Chart
The statistical analysis conducted on geographies consisting of 578,615,396 people shows a very strong negative correlation between the proportion of Hispanics or Latinos and percentage of population with at least 3rd grade education in the United States with a correlation coefficient (R) of -0.895 and weighted average of 96.5%. Similarly, the statistical analysis conducted on geographies consisting of 224,856,650 people shows a weak positive correlation between the proportion of Laotians and percentage of population with at least 3rd grade education in the United States with a correlation coefficient (R) of 0.287 and weighted average of 97.6%, a difference of 1.1%.
3rd Grade Correlation Summary
| Measurement | Hispanic or Latino | Laotian |
| Minimum | 91.8% | 91.5% |
| Maximum | 99.1% | 100.0% |
| Range | 7.2% | 8.5% |
| Mean | 96.1% | 98.2% |
| Median | 96.1% | 98.5% |
| Interquartile 25% (IQ1) | 94.6% | 97.6% |
| Interquartile 75% (IQ3) | 97.6% | 99.6% |
| Interquartile Range (IQR) | 3.1% | 2.0% |
| Standard Deviation (Sample) | 1.8% | 2.0% |
| Standard Deviation (Population) | 1.8% | 2.0% |
Similar Demographics by 3rd Grade
Demographics Similar to Hispanics or Latinos by 3rd Grade
In terms of 3rd grade, the demographic groups most similar to Hispanics or Latinos are Vietnamese (96.5%, a difference of 0.010%), Immigrants from Bangladesh (96.6%, a difference of 0.020%), Immigrants from Nicaragua (96.5%, a difference of 0.020%), Indonesian (96.5%, a difference of 0.030%), and Immigrants from Belize (96.5%, a difference of 0.030%).
| Demographics | Rating | Rank | 3rd Grade |
| Immigrants | Guyana | 0.0 /100 | #311 | Tragic 96.6% |
| Immigrants | Laos | 0.0 /100 | #312 | Tragic 96.6% |
| Immigrants | Ecuador | 0.0 /100 | #313 | Tragic 96.6% |
| Belizeans | 0.0 /100 | #314 | Tragic 96.6% |
| Immigrants | Azores | 0.0 /100 | #315 | Tragic 96.6% |
| Immigrants | Burma/Myanmar | 0.0 /100 | #316 | Tragic 96.6% |
| Immigrants | Bangladesh | 0.0 /100 | #317 | Tragic 96.6% |
| Hispanics or Latinos | 0.0 /100 | #318 | Tragic 96.5% |
| Vietnamese | 0.0 /100 | #319 | Tragic 96.5% |
| Immigrants | Nicaragua | 0.0 /100 | #320 | Tragic 96.5% |
| Indonesians | 0.0 /100 | #321 | Tragic 96.5% |
| Immigrants | Belize | 0.0 /100 | #322 | Tragic 96.5% |
| Hondurans | 0.0 /100 | #323 | Tragic 96.5% |
| Dominicans | 0.0 /100 | #324 | Tragic 96.4% |
| Mexican American Indians | 0.0 /100 | #325 | Tragic 96.4% |
Demographics Similar to Laotians by 3rd Grade
In terms of 3rd grade, the demographic groups most similar to Laotians are Costa Rican (97.6%, a difference of 0.0%), Immigrants from Oceania (97.6%, a difference of 0.0%), Immigrants from Bahamas (97.6%, a difference of 0.010%), Moroccan (97.6%, a difference of 0.010%), and Yuman (97.6%, a difference of 0.010%).
| Demographics | Rating | Rank | 3rd Grade |
| Immigrants | Chile | 16.5 /100 | #204 | Poor 97.6% |
| Africans | 14.5 /100 | #205 | Poor 97.6% |
| Immigrants | Northern Africa | 13.0 /100 | #206 | Poor 97.6% |
| Tohono O'odham | 12.5 /100 | #207 | Poor 97.6% |
| Immigrants | Zaire | 11.9 /100 | #208 | Poor 97.6% |
| Costa Ricans | 9.6 /100 | #209 | Tragic 97.6% |
| Immigrants | Oceania | 9.5 /100 | #210 | Tragic 97.6% |
| Laotians | 9.4 /100 | #211 | Tragic 97.6% |
| Immigrants | Bahamas | 8.5 /100 | #212 | Tragic 97.6% |
| Moroccans | 8.5 /100 | #213 | Tragic 97.6% |
| Yuman | 8.4 /100 | #214 | Tragic 97.6% |
| Iraqis | 6.9 /100 | #215 | Tragic 97.5% |
| Samoans | 6.9 /100 | #216 | Tragic 97.5% |
| South American Indians | 5.7 /100 | #217 | Tragic 97.5% |
| Immigrants | Nepal | 5.3 /100 | #218 | Tragic 97.5% |