Swiss vs Laotian Hearing Disability
COMPARE
Swiss
Laotian
Hearing Disability
Hearing Disability Comparison
Swiss
Laotians
3.5%
HEARING DISABILITY
0.0/ 100
METRIC RATING
274th/ 347
METRIC RANK
2.9%
HEARING DISABILITY
81.1/ 100
METRIC RATING
142nd/ 347
METRIC RANK
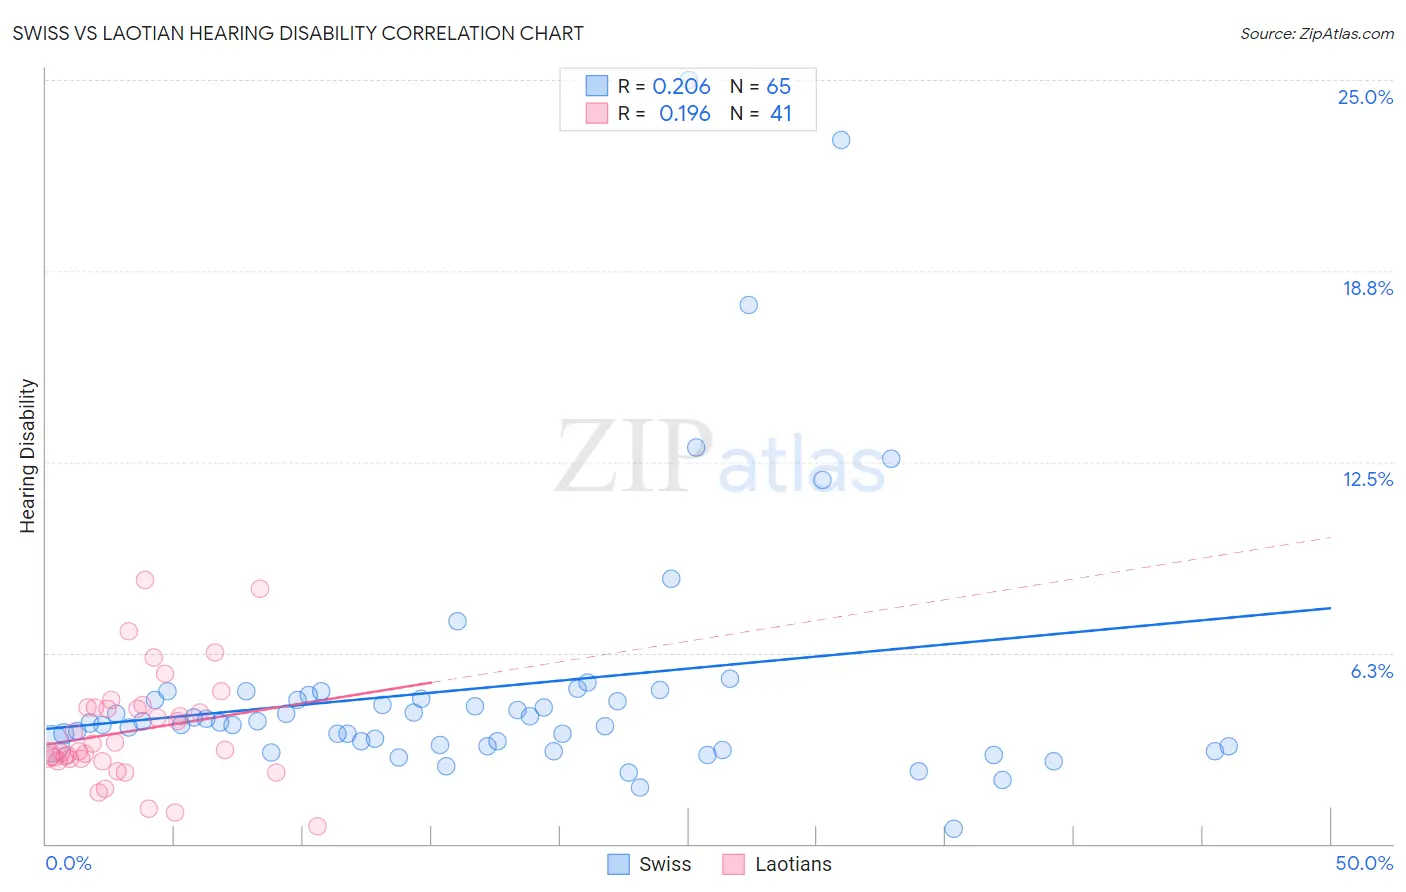
Swiss vs Laotian Hearing Disability Correlation Chart
The statistical analysis conducted on geographies consisting of 464,835,494 people shows a weak positive correlation between the proportion of Swiss and percentage of population with hearing disability in the United States with a correlation coefficient (R) of 0.206 and weighted average of 3.5%. Similarly, the statistical analysis conducted on geographies consisting of 224,832,654 people shows a poor positive correlation between the proportion of Laotians and percentage of population with hearing disability in the United States with a correlation coefficient (R) of 0.196 and weighted average of 2.9%, a difference of 22.5%.
Hearing Disability Correlation Summary
| Measurement | Swiss | Laotian |
| Minimum | 0.50% | 0.57% |
| Maximum | 25.0% | 8.6% |
| Range | 24.5% | 8.0% |
| Mean | 5.1% | 3.7% |
| Median | 4.0% | 3.1% |
| Interquartile 25% (IQ1) | 3.2% | 2.7% |
| Interquartile 75% (IQ3) | 4.8% | 4.5% |
| Interquartile Range (IQR) | 1.6% | 1.7% |
| Standard Deviation (Sample) | 4.3% | 1.8% |
| Standard Deviation (Population) | 4.3% | 1.7% |
Similar Demographics by Hearing Disability
Demographics Similar to Swiss by Hearing Disability
In terms of hearing disability, the demographic groups most similar to Swiss are Czechoslovakian (3.6%, a difference of 0.20%), Puerto Rican (3.5%, a difference of 0.32%), Danish (3.6%, a difference of 0.32%), Fijian (3.5%, a difference of 0.39%), and Czech (3.5%, a difference of 0.66%).
| Demographics | Rating | Rank | Hearing Disability |
| Canadians | 0.1 /100 | #267 | Tragic 3.5% |
| Spaniards | 0.1 /100 | #268 | Tragic 3.5% |
| Ute | 0.1 /100 | #269 | Tragic 3.5% |
| Europeans | 0.1 /100 | #270 | Tragic 3.5% |
| Czechs | 0.1 /100 | #271 | Tragic 3.5% |
| Fijians | 0.0 /100 | #272 | Tragic 3.5% |
| Puerto Ricans | 0.0 /100 | #273 | Tragic 3.5% |
| Swiss | 0.0 /100 | #274 | Tragic 3.5% |
| Czechoslovakians | 0.0 /100 | #275 | Tragic 3.6% |
| Danes | 0.0 /100 | #276 | Tragic 3.6% |
| Immigrants | Nonimmigrants | 0.0 /100 | #277 | Tragic 3.6% |
| Basques | 0.0 /100 | #278 | Tragic 3.6% |
| Slovaks | 0.0 /100 | #279 | Tragic 3.6% |
| French American Indians | 0.0 /100 | #280 | Tragic 3.6% |
| Scandinavians | 0.0 /100 | #281 | Tragic 3.6% |
Demographics Similar to Laotians by Hearing Disability
In terms of hearing disability, the demographic groups most similar to Laotians are Immigrants from Bahamas (2.9%, a difference of 0.020%), Immigrants from Bulgaria (2.9%, a difference of 0.29%), Immigrants from Congo (2.9%, a difference of 0.34%), Brazilian (2.9%, a difference of 0.36%), and Subsaharan African (2.9%, a difference of 0.37%).
| Demographics | Rating | Rank | Hearing Disability |
| Soviet Union | 84.8 /100 | #135 | Excellent 2.9% |
| Immigrants | Brazil | 84.6 /100 | #136 | Excellent 2.9% |
| Sri Lankans | 84.1 /100 | #137 | Excellent 2.9% |
| Immigrants | Costa Rica | 84.0 /100 | #138 | Excellent 2.9% |
| Bermudans | 83.8 /100 | #139 | Excellent 2.9% |
| Immigrants | Jordan | 83.7 /100 | #140 | Excellent 2.9% |
| Sub-Saharan Africans | 83.3 /100 | #141 | Excellent 2.9% |
| Laotians | 81.1 /100 | #142 | Excellent 2.9% |
| Immigrants | Bahamas | 80.9 /100 | #143 | Excellent 2.9% |
| Immigrants | Bulgaria | 79.2 /100 | #144 | Good 2.9% |
| Immigrants | Congo | 78.9 /100 | #145 | Good 2.9% |
| Brazilians | 78.7 /100 | #146 | Good 2.9% |
| Tongans | 78.6 /100 | #147 | Good 2.9% |
| Immigrants | Russia | 77.7 /100 | #148 | Good 2.9% |
| Immigrants | Panama | 76.9 /100 | #149 | Good 2.9% |