Hispanic or Latino vs French Hearing Disability
COMPARE
Hispanic or Latino
French
Hearing Disability
Hearing Disability Comparison
Hispanics or Latinos
French
3.1%
HEARING DISABILITY
15.1/ 100
METRIC RATING
207th/ 347
METRIC RANK
3.8%
HEARING DISABILITY
0.0/ 100
METRIC RATING
304th/ 347
METRIC RANK
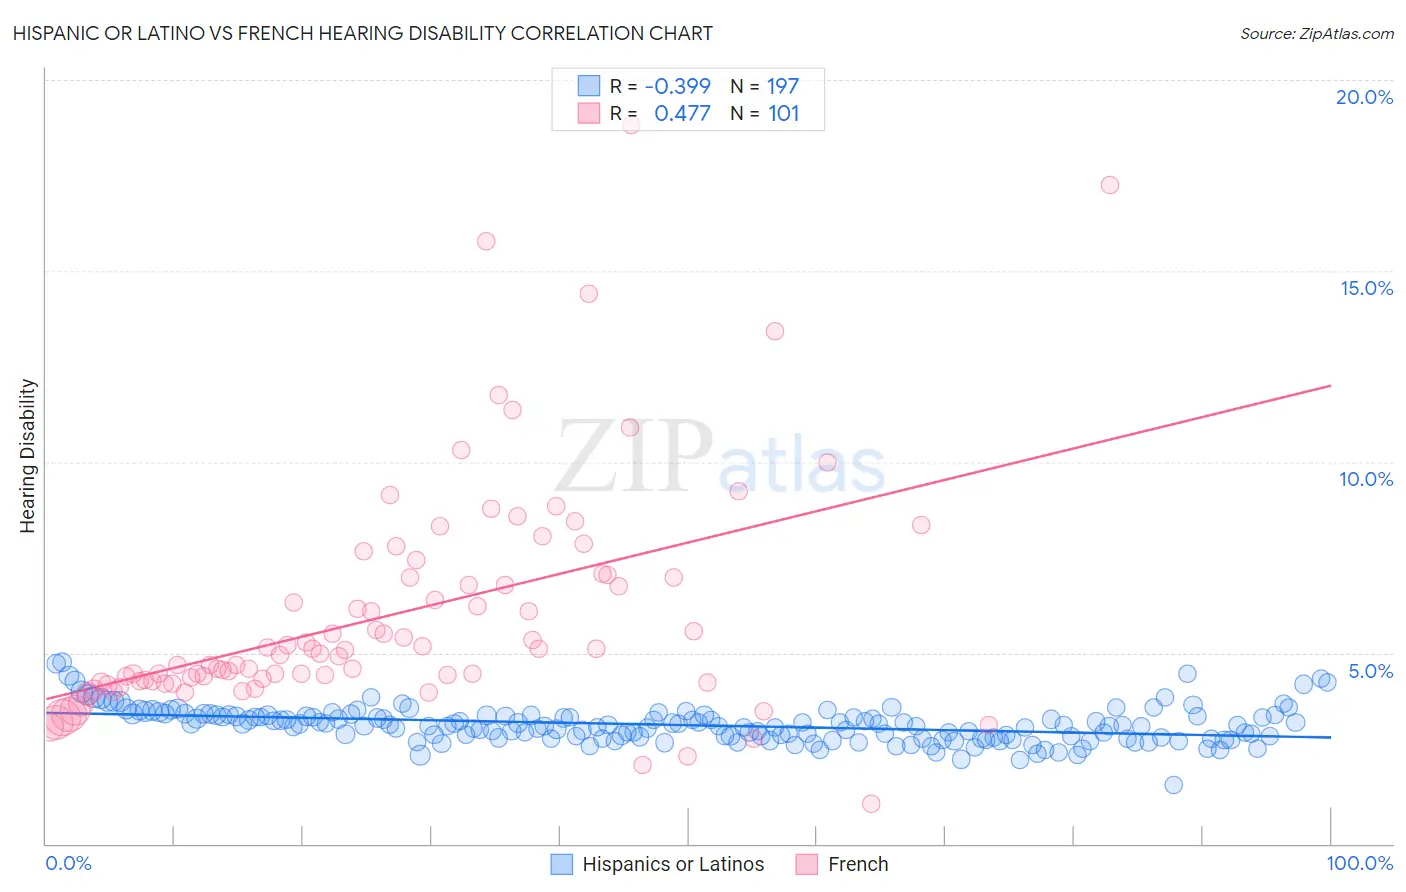
Hispanic or Latino vs French Hearing Disability Correlation Chart
The statistical analysis conducted on geographies consisting of 570,237,836 people shows a mild negative correlation between the proportion of Hispanics or Latinos and percentage of population with hearing disability in the United States with a correlation coefficient (R) of -0.399 and weighted average of 3.1%. Similarly, the statistical analysis conducted on geographies consisting of 571,744,911 people shows a moderate positive correlation between the proportion of French and percentage of population with hearing disability in the United States with a correlation coefficient (R) of 0.477 and weighted average of 3.8%, a difference of 20.4%.
Hearing Disability Correlation Summary
| Measurement | Hispanic or Latino | French |
| Minimum | 1.5% | 1.1% |
| Maximum | 4.8% | 18.8% |
| Range | 3.2% | 17.8% |
| Mean | 3.1% | 6.0% |
| Median | 3.1% | 5.0% |
| Interquartile 25% (IQ1) | 2.8% | 4.2% |
| Interquartile 75% (IQ3) | 3.4% | 7.0% |
| Interquartile Range (IQR) | 0.57% | 2.8% |
| Standard Deviation (Sample) | 0.46% | 3.1% |
| Standard Deviation (Population) | 0.46% | 3.1% |
Similar Demographics by Hearing Disability
Demographics Similar to Hispanics or Latinos by Hearing Disability
In terms of hearing disability, the demographic groups most similar to Hispanics or Latinos are Eastern European (3.1%, a difference of 0.070%), Immigrants from Czechoslovakia (3.1%, a difference of 0.13%), Alsatian (3.1%, a difference of 0.13%), Immigrants from Denmark (3.1%, a difference of 0.18%), and Immigrants from Thailand (3.1%, a difference of 0.22%).
| Demographics | Rating | Rank | Hearing Disability |
| Immigrants | North Macedonia | 19.1 /100 | #200 | Poor 3.1% |
| Iraqis | 19.0 /100 | #201 | Poor 3.1% |
| Immigrants | Thailand | 16.4 /100 | #202 | Poor 3.1% |
| Immigrants | Denmark | 16.2 /100 | #203 | Poor 3.1% |
| Immigrants | Czechoslovakia | 15.9 /100 | #204 | Poor 3.1% |
| Alsatians | 15.9 /100 | #205 | Poor 3.1% |
| Eastern Europeans | 15.5 /100 | #206 | Poor 3.1% |
| Hispanics or Latinos | 15.1 /100 | #207 | Poor 3.1% |
| Immigrants | Latvia | 12.7 /100 | #208 | Poor 3.1% |
| Immigrants | Hungary | 12.5 /100 | #209 | Poor 3.1% |
| Cape Verdeans | 12.2 /100 | #210 | Poor 3.1% |
| Romanians | 12.1 /100 | #211 | Poor 3.1% |
| Pakistanis | 11.1 /100 | #212 | Poor 3.1% |
| Immigrants | Iraq | 10.5 /100 | #213 | Poor 3.1% |
| Australians | 8.1 /100 | #214 | Tragic 3.2% |
Demographics Similar to French by Hearing Disability
In terms of hearing disability, the demographic groups most similar to French are Menominee (3.7%, a difference of 0.30%), Dutch (3.7%, a difference of 0.36%), Pennsylvania German (3.7%, a difference of 0.47%), Scottish (3.7%, a difference of 0.49%), and German (3.7%, a difference of 0.56%).
| Demographics | Rating | Rank | Hearing Disability |
| Immigrants | Azores | 0.0 /100 | #297 | Tragic 3.7% |
| Celtics | 0.0 /100 | #298 | Tragic 3.7% |
| Germans | 0.0 /100 | #299 | Tragic 3.7% |
| Scottish | 0.0 /100 | #300 | Tragic 3.7% |
| Pennsylvania Germans | 0.0 /100 | #301 | Tragic 3.7% |
| Dutch | 0.0 /100 | #302 | Tragic 3.7% |
| Menominee | 0.0 /100 | #303 | Tragic 3.7% |
| French | 0.0 /100 | #304 | Tragic 3.8% |
| English | 0.0 /100 | #305 | Tragic 3.8% |
| Marshallese | 0.0 /100 | #306 | Tragic 3.8% |
| French Canadians | 0.0 /100 | #307 | Tragic 3.8% |
| Ottawa | 0.0 /100 | #308 | Tragic 3.8% |
| Scotch-Irish | 0.0 /100 | #309 | Tragic 3.8% |
| Cree | 0.0 /100 | #310 | Tragic 3.8% |
| Americans | 0.0 /100 | #311 | Tragic 3.9% |