South American Indian vs Laotian Hearing Disability
COMPARE
South American Indian
Laotian
Hearing Disability
Hearing Disability Comparison
South American Indians
Laotians
2.9%
HEARING DISABILITY
86.9/ 100
METRIC RATING
127th/ 347
METRIC RANK
2.9%
HEARING DISABILITY
81.1/ 100
METRIC RATING
142nd/ 347
METRIC RANK
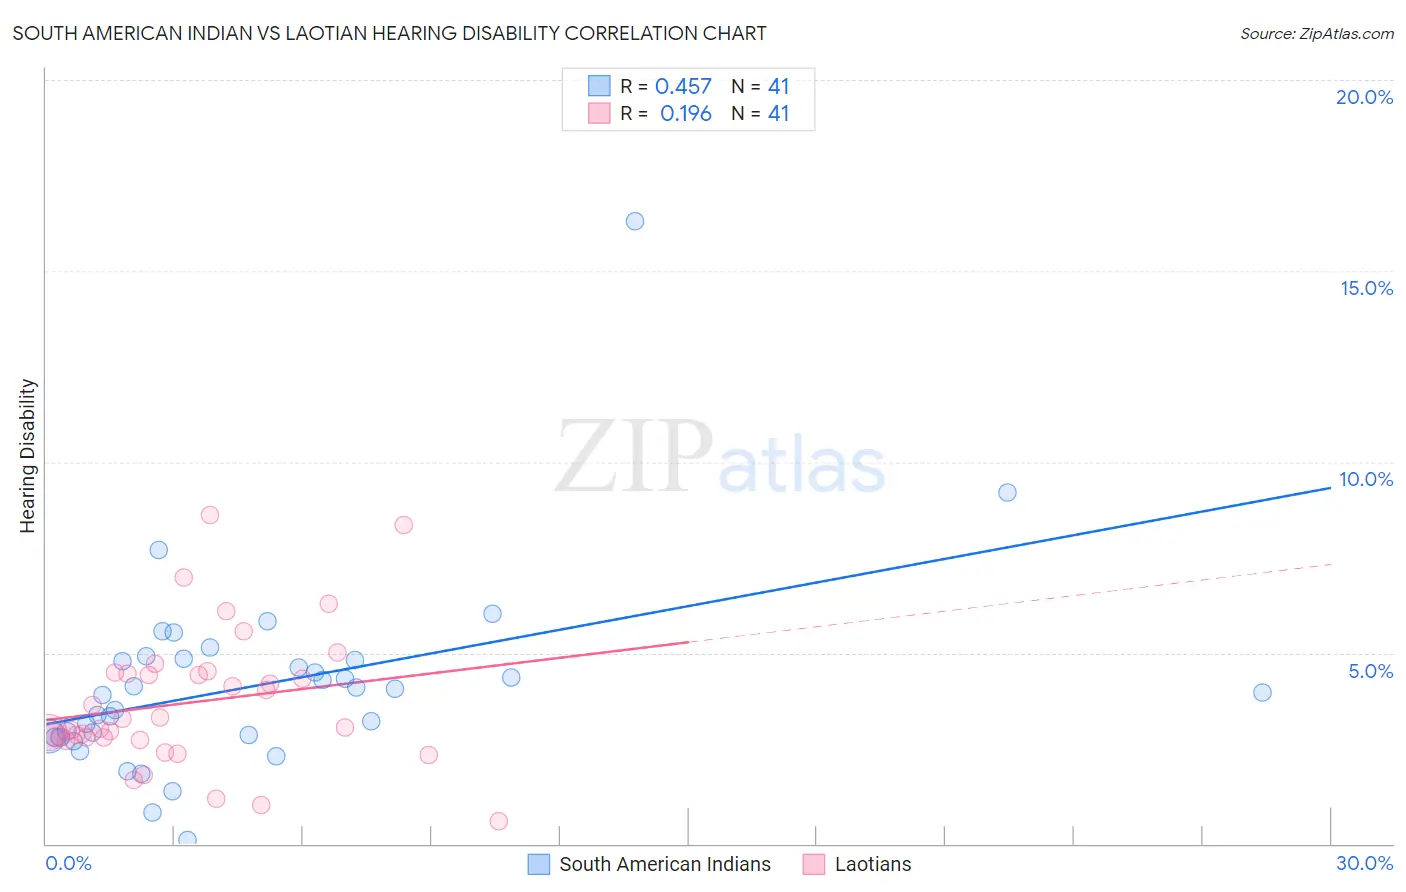
South American Indian vs Laotian Hearing Disability Correlation Chart
The statistical analysis conducted on geographies consisting of 164,558,216 people shows a moderate positive correlation between the proportion of South American Indians and percentage of population with hearing disability in the United States with a correlation coefficient (R) of 0.457 and weighted average of 2.9%. Similarly, the statistical analysis conducted on geographies consisting of 224,832,654 people shows a poor positive correlation between the proportion of Laotians and percentage of population with hearing disability in the United States with a correlation coefficient (R) of 0.196 and weighted average of 2.9%, a difference of 1.1%.
Hearing Disability Correlation Summary
| Measurement | South American Indian | Laotian |
| Minimum | 0.098% | 0.57% |
| Maximum | 16.3% | 8.6% |
| Range | 16.2% | 8.0% |
| Mean | 4.1% | 3.7% |
| Median | 4.0% | 3.1% |
| Interquartile 25% (IQ1) | 2.8% | 2.7% |
| Interquartile 75% (IQ3) | 4.8% | 4.5% |
| Interquartile Range (IQR) | 2.0% | 1.7% |
| Standard Deviation (Sample) | 2.6% | 1.8% |
| Standard Deviation (Population) | 2.6% | 1.7% |
Demographics Similar to South American Indians and Laotians by Hearing Disability
In terms of hearing disability, the demographic groups most similar to South American Indians are Immigrants from Western Asia (2.9%, a difference of 0.0%), Immigrants from Uganda (2.9%, a difference of 0.050%), Immigrants from Vietnam (2.9%, a difference of 0.070%), Immigrants from Kenya (2.9%, a difference of 0.16%), and Chilean (2.9%, a difference of 0.21%). Similarly, the demographic groups most similar to Laotians are Immigrants from Bahamas (2.9%, a difference of 0.020%), Immigrants from Bulgaria (2.9%, a difference of 0.29%), Subsaharan African (2.9%, a difference of 0.37%), Immigrants from Jordan (2.9%, a difference of 0.44%), and Bermudan (2.9%, a difference of 0.45%).
| Demographics | Rating | Rank | Hearing Disability |
| Bahamians | 88.6 /100 | #124 | Excellent 2.9% |
| Immigrants | Albania | 88.5 /100 | #125 | Excellent 2.9% |
| Immigrants | Sudan | 87.8 /100 | #126 | Excellent 2.9% |
| South American Indians | 86.9 /100 | #127 | Excellent 2.9% |
| Immigrants | Western Asia | 86.9 /100 | #128 | Excellent 2.9% |
| Immigrants | Uganda | 86.6 /100 | #129 | Excellent 2.9% |
| Immigrants | Vietnam | 86.5 /100 | #130 | Excellent 2.9% |
| Immigrants | Kenya | 86.1 /100 | #131 | Excellent 2.9% |
| Chileans | 85.8 /100 | #132 | Excellent 2.9% |
| Immigrants | Syria | 85.8 /100 | #133 | Excellent 2.9% |
| Ugandans | 85.5 /100 | #134 | Excellent 2.9% |
| Soviet Union | 84.8 /100 | #135 | Excellent 2.9% |
| Immigrants | Brazil | 84.6 /100 | #136 | Excellent 2.9% |
| Sri Lankans | 84.1 /100 | #137 | Excellent 2.9% |
| Immigrants | Costa Rica | 84.0 /100 | #138 | Excellent 2.9% |
| Bermudans | 83.8 /100 | #139 | Excellent 2.9% |
| Immigrants | Jordan | 83.7 /100 | #140 | Excellent 2.9% |
| Sub-Saharan Africans | 83.3 /100 | #141 | Excellent 2.9% |
| Laotians | 81.1 /100 | #142 | Excellent 2.9% |
| Immigrants | Bahamas | 80.9 /100 | #143 | Excellent 2.9% |
| Immigrants | Bulgaria | 79.2 /100 | #144 | Good 2.9% |