Hispanic or Latino vs Laotian Female Unemployment
COMPARE
Hispanic or Latino
Laotian
Female Unemployment
Female Unemployment Comparison
Hispanics or Latinos
Laotians
6.2%
FEMALE UNEMPLOYMENT
0.0/ 100
METRIC RATING
308th/ 347
METRIC RANK
5.3%
FEMALE UNEMPLOYMENT
45.1/ 100
METRIC RATING
179th/ 347
METRIC RANK
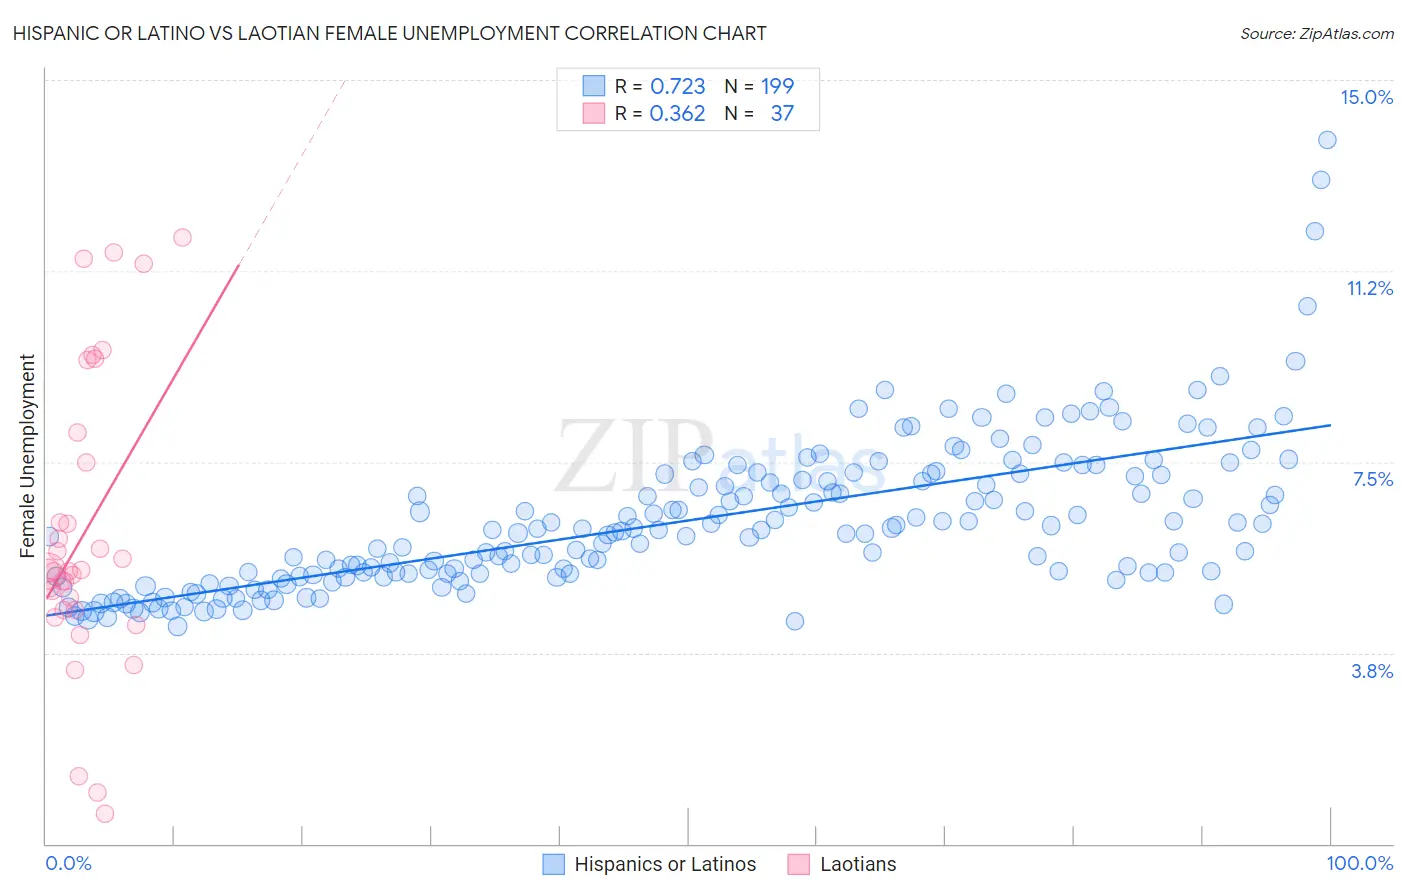
Hispanic or Latino vs Laotian Female Unemployment Correlation Chart
The statistical analysis conducted on geographies consisting of 562,804,515 people shows a strong positive correlation between the proportion of Hispanics or Latinos and unemploymnet rate among females in the United States with a correlation coefficient (R) of 0.723 and weighted average of 6.2%. Similarly, the statistical analysis conducted on geographies consisting of 224,555,281 people shows a mild positive correlation between the proportion of Laotians and unemploymnet rate among females in the United States with a correlation coefficient (R) of 0.362 and weighted average of 5.3%, a difference of 18.2%.
Female Unemployment Correlation Summary
| Measurement | Hispanic or Latino | Laotian |
| Minimum | 4.3% | 0.60% |
| Maximum | 13.8% | 11.9% |
| Range | 9.5% | 11.3% |
| Mean | 6.3% | 6.1% |
| Median | 6.1% | 5.4% |
| Interquartile 25% (IQ1) | 5.3% | 4.6% |
| Interquartile 75% (IQ3) | 7.2% | 7.8% |
| Interquartile Range (IQR) | 1.9% | 3.2% |
| Standard Deviation (Sample) | 1.5% | 2.9% |
| Standard Deviation (Population) | 1.5% | 2.8% |
Similar Demographics by Female Unemployment
Demographics Similar to Hispanics or Latinos by Female Unemployment
In terms of female unemployment, the demographic groups most similar to Hispanics or Latinos are Shoshone (6.2%, a difference of 0.060%), Immigrants from Central America (6.2%, a difference of 0.070%), Spanish American Indian (6.2%, a difference of 0.23%), Immigrants from Jamaica (6.2%, a difference of 0.29%), and Ecuadorian (6.3%, a difference of 0.58%).
| Demographics | Rating | Rank | Female Unemployment |
| Immigrants | Barbados | 0.0 /100 | #301 | Tragic 6.2% |
| U.S. Virgin Islanders | 0.0 /100 | #302 | Tragic 6.2% |
| Barbadians | 0.0 /100 | #303 | Tragic 6.2% |
| Immigrants | Jamaica | 0.0 /100 | #304 | Tragic 6.2% |
| Spanish American Indians | 0.0 /100 | #305 | Tragic 6.2% |
| Immigrants | Central America | 0.0 /100 | #306 | Tragic 6.2% |
| Shoshone | 0.0 /100 | #307 | Tragic 6.2% |
| Hispanics or Latinos | 0.0 /100 | #308 | Tragic 6.2% |
| Ecuadorians | 0.0 /100 | #309 | Tragic 6.3% |
| Central American Indians | 0.0 /100 | #310 | Tragic 6.3% |
| Immigrants | Mexico | 0.0 /100 | #311 | Tragic 6.3% |
| Immigrants | Grenada | 0.0 /100 | #312 | Tragic 6.3% |
| Belizeans | 0.0 /100 | #313 | Tragic 6.3% |
| Immigrants | Ecuador | 0.0 /100 | #314 | Tragic 6.4% |
| Pueblo | 0.0 /100 | #315 | Tragic 6.4% |
Demographics Similar to Laotians by Female Unemployment
In terms of female unemployment, the demographic groups most similar to Laotians are Immigrants from Southern Europe (5.3%, a difference of 0.070%), Immigrants from Congo (5.3%, a difference of 0.12%), Immigrants from Vietnam (5.3%, a difference of 0.14%), Immigrants from Morocco (5.3%, a difference of 0.14%), and Taiwanese (5.3%, a difference of 0.14%).
| Demographics | Rating | Rank | Female Unemployment |
| Immigrants | Uganda | 50.7 /100 | #172 | Average 5.3% |
| Iranians | 50.4 /100 | #173 | Average 5.3% |
| Immigrants | Poland | 50.0 /100 | #174 | Average 5.3% |
| Immigrants | Laos | 47.5 /100 | #175 | Average 5.3% |
| Immigrants | Vietnam | 47.5 /100 | #176 | Average 5.3% |
| Immigrants | Morocco | 47.4 /100 | #177 | Average 5.3% |
| Immigrants | Southern Europe | 46.2 /100 | #178 | Average 5.3% |
| Laotians | 45.1 /100 | #179 | Average 5.3% |
| Immigrants | Congo | 43.1 /100 | #180 | Average 5.3% |
| Taiwanese | 42.7 /100 | #181 | Average 5.3% |
| Immigrants | Nonimmigrants | 42.6 /100 | #182 | Average 5.3% |
| Immigrants | Indonesia | 40.7 /100 | #183 | Average 5.3% |
| Immigrants | Ukraine | 40.1 /100 | #184 | Average 5.3% |
| Malaysians | 40.1 /100 | #185 | Average 5.3% |
| Immigrants | Belarus | 39.4 /100 | #186 | Fair 5.3% |