Hispanic or Latino vs Mexican Hearing Disability
COMPARE
Hispanic or Latino
Mexican
Hearing Disability
Hearing Disability Comparison
Hispanics or Latinos
Mexicans
3.1%
HEARING DISABILITY
15.1/ 100
METRIC RATING
207th/ 347
METRIC RANK
3.2%
HEARING DISABILITY
5.6/ 100
METRIC RATING
223rd/ 347
METRIC RANK
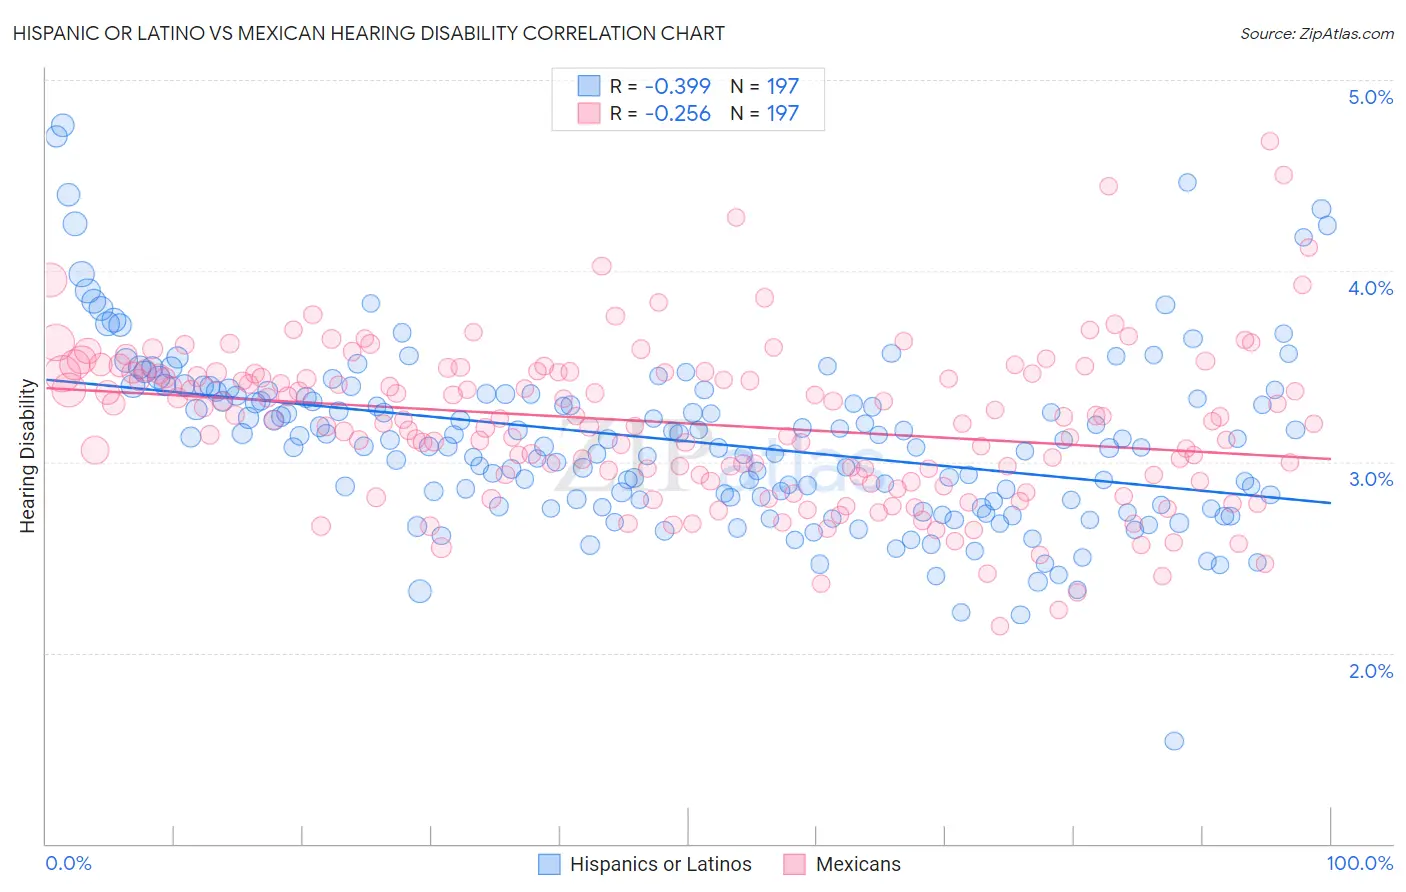
Hispanic or Latino vs Mexican Hearing Disability Correlation Chart
The statistical analysis conducted on geographies consisting of 570,237,836 people shows a mild negative correlation between the proportion of Hispanics or Latinos and percentage of population with hearing disability in the United States with a correlation coefficient (R) of -0.399 and weighted average of 3.1%. Similarly, the statistical analysis conducted on geographies consisting of 564,483,125 people shows a weak negative correlation between the proportion of Mexicans and percentage of population with hearing disability in the United States with a correlation coefficient (R) of -0.256 and weighted average of 3.2%, a difference of 2.5%.
Hearing Disability Correlation Summary
| Measurement | Hispanic or Latino | Mexican |
| Minimum | 1.5% | 2.1% |
| Maximum | 4.8% | 4.7% |
| Range | 3.2% | 2.5% |
| Mean | 3.1% | 3.2% |
| Median | 3.1% | 3.2% |
| Interquartile 25% (IQ1) | 2.8% | 2.9% |
| Interquartile 75% (IQ3) | 3.4% | 3.5% |
| Interquartile Range (IQR) | 0.57% | 0.56% |
| Standard Deviation (Sample) | 0.46% | 0.41% |
| Standard Deviation (Population) | 0.46% | 0.41% |
Demographics Similar to Hispanics or Latinos and Mexicans by Hearing Disability
In terms of hearing disability, the demographic groups most similar to Hispanics or Latinos are Eastern European (3.1%, a difference of 0.070%), Alsatian (3.1%, a difference of 0.13%), Immigrants from Latvia (3.1%, a difference of 0.46%), Immigrants from Hungary (3.1%, a difference of 0.50%), and Cape Verdean (3.1%, a difference of 0.55%). Similarly, the demographic groups most similar to Mexicans are Icelander (3.2%, a difference of 0.17%), Latvian (3.2%, a difference of 0.21%), Immigrants from Oceania (3.2%, a difference of 0.36%), Immigrants from Laos (3.2%, a difference of 0.40%), and Malaysian (3.2%, a difference of 0.41%).
| Demographics | Rating | Rank | Hearing Disability |
| Alsatians | 15.9 /100 | #205 | Poor 3.1% |
| Eastern Europeans | 15.5 /100 | #206 | Poor 3.1% |
| Hispanics or Latinos | 15.1 /100 | #207 | Poor 3.1% |
| Immigrants | Latvia | 12.7 /100 | #208 | Poor 3.1% |
| Immigrants | Hungary | 12.5 /100 | #209 | Poor 3.1% |
| Cape Verdeans | 12.2 /100 | #210 | Poor 3.1% |
| Romanians | 12.1 /100 | #211 | Poor 3.1% |
| Pakistanis | 11.1 /100 | #212 | Poor 3.1% |
| Immigrants | Iraq | 10.5 /100 | #213 | Poor 3.1% |
| Australians | 8.1 /100 | #214 | Tragic 3.2% |
| Bangladeshis | 8.1 /100 | #215 | Tragic 3.2% |
| Immigrants | Norway | 7.3 /100 | #216 | Tragic 3.2% |
| Russians | 7.1 /100 | #217 | Tragic 3.2% |
| Immigrants | Northern Europe | 7.0 /100 | #218 | Tragic 3.2% |
| New Zealanders | 6.8 /100 | #219 | Tragic 3.2% |
| Malaysians | 6.6 /100 | #220 | Tragic 3.2% |
| Immigrants | Laos | 6.6 /100 | #221 | Tragic 3.2% |
| Immigrants | Oceania | 6.5 /100 | #222 | Tragic 3.2% |
| Mexicans | 5.6 /100 | #223 | Tragic 3.2% |
| Icelanders | 5.2 /100 | #224 | Tragic 3.2% |
| Latvians | 5.1 /100 | #225 | Tragic 3.2% |