Immigrants from Uganda vs Laotian Hearing Disability
COMPARE
Immigrants from Uganda
Laotian
Hearing Disability
Hearing Disability Comparison
Immigrants from Uganda
Laotians
2.9%
HEARING DISABILITY
86.6/ 100
METRIC RATING
129th/ 347
METRIC RANK
2.9%
HEARING DISABILITY
81.1/ 100
METRIC RATING
142nd/ 347
METRIC RANK
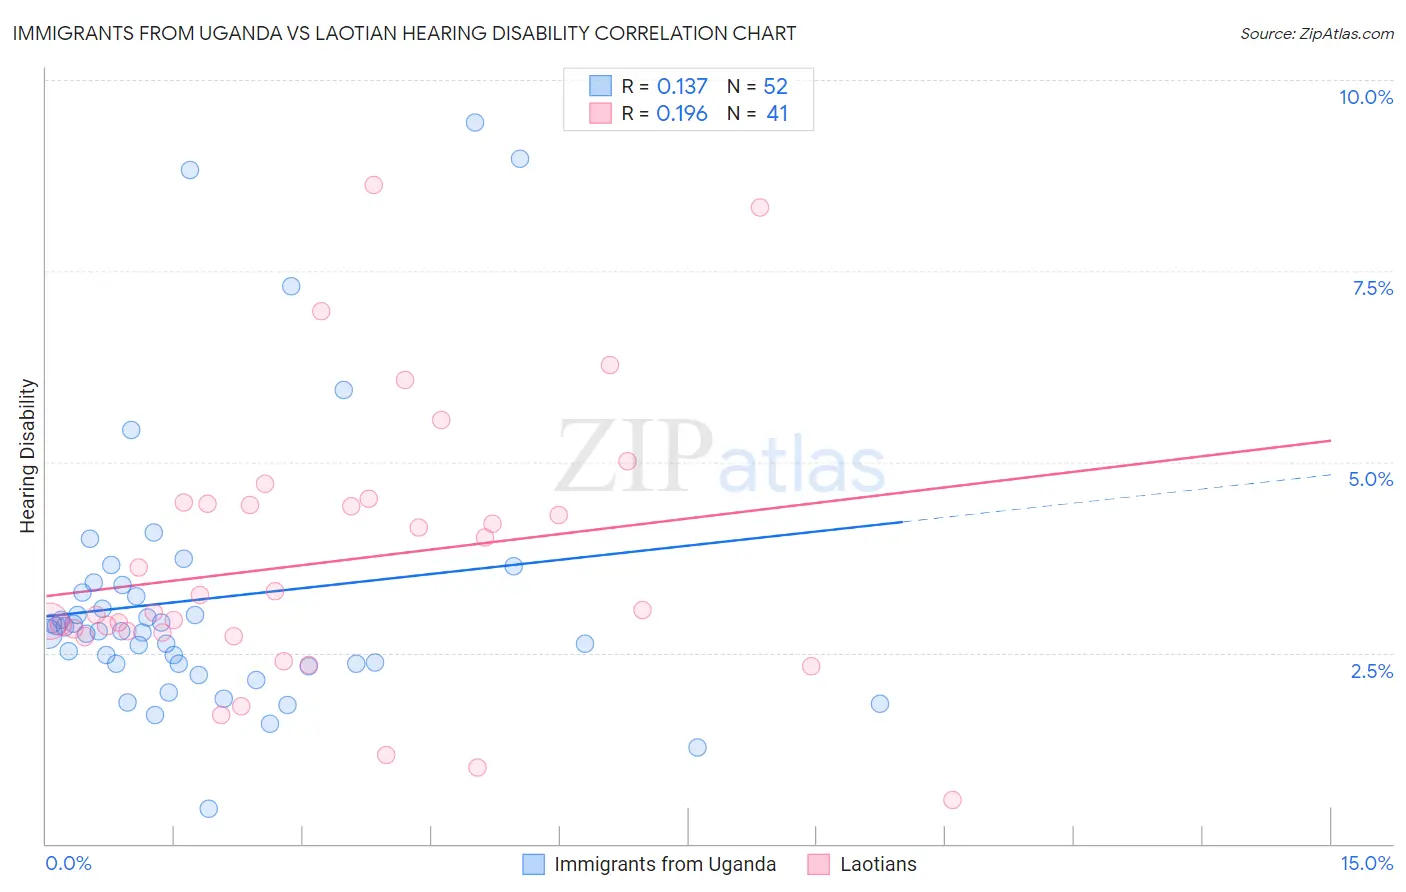
Immigrants from Uganda vs Laotian Hearing Disability Correlation Chart
The statistical analysis conducted on geographies consisting of 125,979,149 people shows a poor positive correlation between the proportion of Immigrants from Uganda and percentage of population with hearing disability in the United States with a correlation coefficient (R) of 0.137 and weighted average of 2.9%. Similarly, the statistical analysis conducted on geographies consisting of 224,832,654 people shows a poor positive correlation between the proportion of Laotians and percentage of population with hearing disability in the United States with a correlation coefficient (R) of 0.196 and weighted average of 2.9%, a difference of 1.0%.
Hearing Disability Correlation Summary
| Measurement | Immigrants from Uganda | Laotian |
| Minimum | 0.45% | 0.57% |
| Maximum | 9.4% | 8.6% |
| Range | 9.0% | 8.0% |
| Mean | 3.2% | 3.7% |
| Median | 2.8% | 3.1% |
| Interquartile 25% (IQ1) | 2.4% | 2.7% |
| Interquartile 75% (IQ3) | 3.3% | 4.5% |
| Interquartile Range (IQR) | 0.98% | 1.7% |
| Standard Deviation (Sample) | 1.8% | 1.8% |
| Standard Deviation (Population) | 1.8% | 1.7% |
Demographics Similar to Immigrants from Uganda and Laotians by Hearing Disability
In terms of hearing disability, the demographic groups most similar to Immigrants from Uganda are Immigrants from Vietnam (2.9%, a difference of 0.020%), South American Indian (2.9%, a difference of 0.050%), Immigrants from Western Asia (2.9%, a difference of 0.050%), Immigrants from Kenya (2.9%, a difference of 0.10%), and Chilean (2.9%, a difference of 0.16%). Similarly, the demographic groups most similar to Laotians are Immigrants from Bahamas (2.9%, a difference of 0.020%), Immigrants from Bulgaria (2.9%, a difference of 0.29%), Immigrants from Congo (2.9%, a difference of 0.34%), Subsaharan African (2.9%, a difference of 0.37%), and Immigrants from Jordan (2.9%, a difference of 0.44%).
| Demographics | Rating | Rank | Hearing Disability |
| Immigrants | Albania | 88.5 /100 | #125 | Excellent 2.9% |
| Immigrants | Sudan | 87.8 /100 | #126 | Excellent 2.9% |
| South American Indians | 86.9 /100 | #127 | Excellent 2.9% |
| Immigrants | Western Asia | 86.9 /100 | #128 | Excellent 2.9% |
| Immigrants | Uganda | 86.6 /100 | #129 | Excellent 2.9% |
| Immigrants | Vietnam | 86.5 /100 | #130 | Excellent 2.9% |
| Immigrants | Kenya | 86.1 /100 | #131 | Excellent 2.9% |
| Chileans | 85.8 /100 | #132 | Excellent 2.9% |
| Immigrants | Syria | 85.8 /100 | #133 | Excellent 2.9% |
| Ugandans | 85.5 /100 | #134 | Excellent 2.9% |
| Soviet Union | 84.8 /100 | #135 | Excellent 2.9% |
| Immigrants | Brazil | 84.6 /100 | #136 | Excellent 2.9% |
| Sri Lankans | 84.1 /100 | #137 | Excellent 2.9% |
| Immigrants | Costa Rica | 84.0 /100 | #138 | Excellent 2.9% |
| Bermudans | 83.8 /100 | #139 | Excellent 2.9% |
| Immigrants | Jordan | 83.7 /100 | #140 | Excellent 2.9% |
| Sub-Saharan Africans | 83.3 /100 | #141 | Excellent 2.9% |
| Laotians | 81.1 /100 | #142 | Excellent 2.9% |
| Immigrants | Bahamas | 80.9 /100 | #143 | Excellent 2.9% |
| Immigrants | Bulgaria | 79.2 /100 | #144 | Good 2.9% |
| Immigrants | Congo | 78.9 /100 | #145 | Good 2.9% |