Immigrants from Caribbean vs Laotian Hearing Disability
COMPARE
Immigrants from Caribbean
Laotian
Hearing Disability
Hearing Disability Comparison
Immigrants from Caribbean
Laotians
2.6%
HEARING DISABILITY
99.7/ 100
METRIC RATING
30th/ 347
METRIC RANK
2.9%
HEARING DISABILITY
81.1/ 100
METRIC RATING
142nd/ 347
METRIC RANK
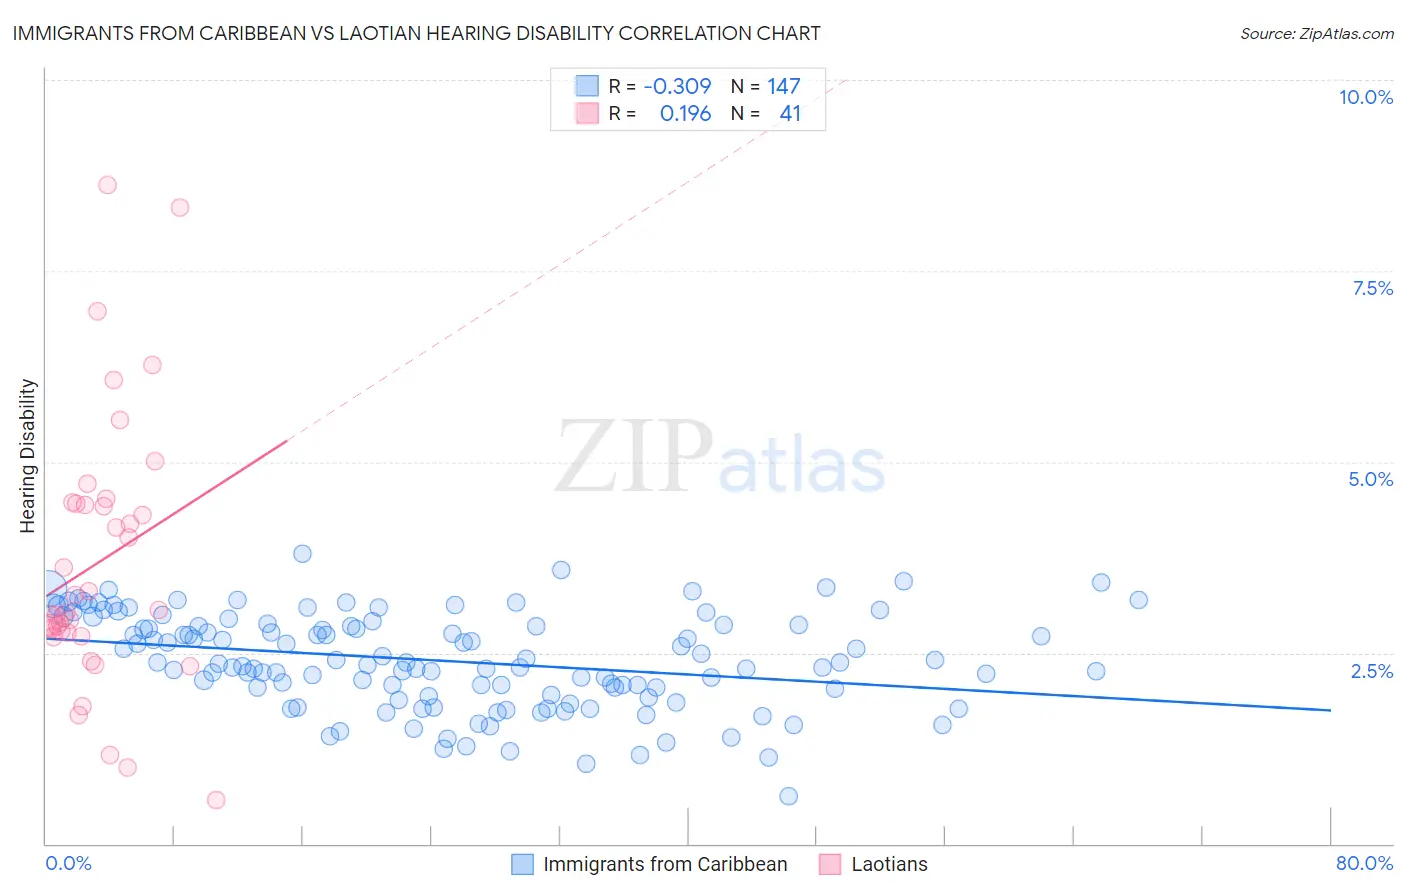
Immigrants from Caribbean vs Laotian Hearing Disability Correlation Chart
The statistical analysis conducted on geographies consisting of 449,729,133 people shows a mild negative correlation between the proportion of Immigrants from Caribbean and percentage of population with hearing disability in the United States with a correlation coefficient (R) of -0.309 and weighted average of 2.6%. Similarly, the statistical analysis conducted on geographies consisting of 224,832,654 people shows a poor positive correlation between the proportion of Laotians and percentage of population with hearing disability in the United States with a correlation coefficient (R) of 0.196 and weighted average of 2.9%, a difference of 11.5%.
Hearing Disability Correlation Summary
| Measurement | Immigrants from Caribbean | Laotian |
| Minimum | 0.62% | 0.57% |
| Maximum | 3.8% | 8.6% |
| Range | 3.2% | 8.0% |
| Mean | 2.4% | 3.7% |
| Median | 2.4% | 3.1% |
| Interquartile 25% (IQ1) | 1.9% | 2.7% |
| Interquartile 75% (IQ3) | 2.9% | 4.5% |
| Interquartile Range (IQR) | 0.93% | 1.7% |
| Standard Deviation (Sample) | 0.62% | 1.8% |
| Standard Deviation (Population) | 0.62% | 1.7% |
Similar Demographics by Hearing Disability
Demographics Similar to Immigrants from Caribbean by Hearing Disability
In terms of hearing disability, the demographic groups most similar to Immigrants from Caribbean are Immigrants from Cameroon (2.6%, a difference of 0.010%), Bolivian (2.6%, a difference of 0.080%), Immigrants from Haiti (2.6%, a difference of 0.10%), Immigrants from Venezuela (2.6%, a difference of 0.16%), and Filipino (2.6%, a difference of 0.42%).
| Demographics | Rating | Rank | Hearing Disability |
| Immigrants | Nigeria | 99.8 /100 | #23 | Exceptional 2.6% |
| Immigrants | Ghana | 99.8 /100 | #24 | Exceptional 2.6% |
| Immigrants | El Salvador | 99.7 /100 | #25 | Exceptional 2.6% |
| Immigrants | Senegal | 99.7 /100 | #26 | Exceptional 2.6% |
| Immigrants | South Central Asia | 99.7 /100 | #27 | Exceptional 2.6% |
| Immigrants | Haiti | 99.7 /100 | #28 | Exceptional 2.6% |
| Bolivians | 99.7 /100 | #29 | Exceptional 2.6% |
| Immigrants | Caribbean | 99.7 /100 | #30 | Exceptional 2.6% |
| Immigrants | Cameroon | 99.7 /100 | #31 | Exceptional 2.6% |
| Immigrants | Venezuela | 99.7 /100 | #32 | Exceptional 2.6% |
| Filipinos | 99.6 /100 | #33 | Exceptional 2.6% |
| Immigrants | Pakistan | 99.6 /100 | #34 | Exceptional 2.6% |
| Salvadorans | 99.6 /100 | #35 | Exceptional 2.6% |
| Okinawans | 99.6 /100 | #36 | Exceptional 2.6% |
| Immigrants | Western Africa | 99.6 /100 | #37 | Exceptional 2.6% |
Demographics Similar to Laotians by Hearing Disability
In terms of hearing disability, the demographic groups most similar to Laotians are Immigrants from Bahamas (2.9%, a difference of 0.020%), Immigrants from Bulgaria (2.9%, a difference of 0.29%), Immigrants from Congo (2.9%, a difference of 0.34%), Brazilian (2.9%, a difference of 0.36%), and Subsaharan African (2.9%, a difference of 0.37%).
| Demographics | Rating | Rank | Hearing Disability |
| Soviet Union | 84.8 /100 | #135 | Excellent 2.9% |
| Immigrants | Brazil | 84.6 /100 | #136 | Excellent 2.9% |
| Sri Lankans | 84.1 /100 | #137 | Excellent 2.9% |
| Immigrants | Costa Rica | 84.0 /100 | #138 | Excellent 2.9% |
| Bermudans | 83.8 /100 | #139 | Excellent 2.9% |
| Immigrants | Jordan | 83.7 /100 | #140 | Excellent 2.9% |
| Sub-Saharan Africans | 83.3 /100 | #141 | Excellent 2.9% |
| Laotians | 81.1 /100 | #142 | Excellent 2.9% |
| Immigrants | Bahamas | 80.9 /100 | #143 | Excellent 2.9% |
| Immigrants | Bulgaria | 79.2 /100 | #144 | Good 2.9% |
| Immigrants | Congo | 78.9 /100 | #145 | Good 2.9% |
| Brazilians | 78.7 /100 | #146 | Good 2.9% |
| Tongans | 78.6 /100 | #147 | Good 2.9% |
| Immigrants | Russia | 77.7 /100 | #148 | Good 2.9% |
| Immigrants | Panama | 76.9 /100 | #149 | Good 2.9% |