Guyanese vs Immigrants from the Azores Disability Age 5 to 17
COMPARE
Guyanese
Immigrants from the Azores
Disability Age 5 to 17
Disability Age 5 to 17 Comparison
Guyanese
Immigrants from the Azores
5.2%
DISABILITY AGE 5 TO 17
99.7/ 100
METRIC RATING
69th/ 347
METRIC RANK
6.7%
DISABILITY AGE 5 TO 17
0.0/ 100
METRIC RATING
332nd/ 347
METRIC RANK
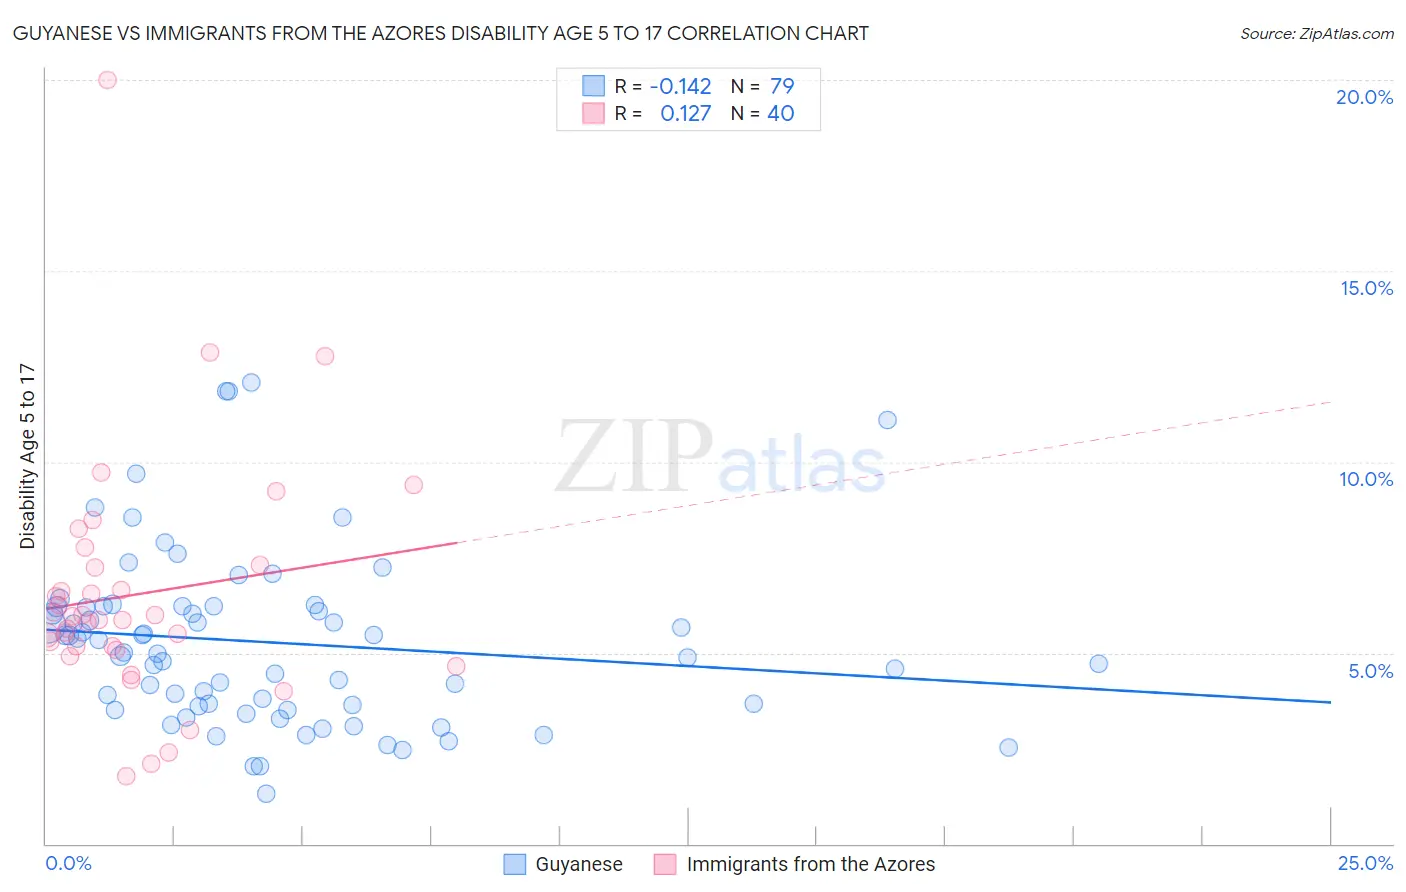
Guyanese vs Immigrants from the Azores Disability Age 5 to 17 Correlation Chart
The statistical analysis conducted on geographies consisting of 176,238,096 people shows a poor negative correlation between the proportion of Guyanese and percentage of population with a disability between the ages 5 and 17 in the United States with a correlation coefficient (R) of -0.142 and weighted average of 5.2%. Similarly, the statistical analysis conducted on geographies consisting of 46,157,711 people shows a poor positive correlation between the proportion of Immigrants from the Azores and percentage of population with a disability between the ages 5 and 17 in the United States with a correlation coefficient (R) of 0.127 and weighted average of 6.7%, a difference of 29.3%.
Disability Age 5 to 17 Correlation Summary
| Measurement | Guyanese | Immigrants from the Azores |
| Minimum | 1.3% | 1.8% |
| Maximum | 12.1% | 20.0% |
| Range | 10.8% | 18.2% |
| Mean | 5.3% | 6.5% |
| Median | 5.0% | 5.9% |
| Interquartile 25% (IQ1) | 3.6% | 5.1% |
| Interquartile 75% (IQ3) | 6.2% | 7.3% |
| Interquartile Range (IQR) | 2.6% | 2.1% |
| Standard Deviation (Sample) | 2.3% | 3.2% |
| Standard Deviation (Population) | 2.3% | 3.2% |
Similar Demographics by Disability Age 5 to 17
Demographics Similar to Guyanese by Disability Age 5 to 17
In terms of disability age 5 to 17, the demographic groups most similar to Guyanese are Immigrants from Belgium (5.2%, a difference of 0.040%), Jordanian (5.2%, a difference of 0.080%), Immigrants from Syria (5.2%, a difference of 0.11%), Immigrants from Vietnam (5.2%, a difference of 0.11%), and Immigrants from Czechoslovakia (5.2%, a difference of 0.13%).
| Demographics | Rating | Rank | Disability Age 5 to 17 |
| Immigrants | Ireland | 99.8 /100 | #62 | Exceptional 5.2% |
| Immigrants | Bangladesh | 99.8 /100 | #63 | Exceptional 5.2% |
| Immigrants | South Eastern Asia | 99.8 /100 | #64 | Exceptional 5.2% |
| Immigrants | Greece | 99.8 /100 | #65 | Exceptional 5.2% |
| Palestinians | 99.8 /100 | #66 | Exceptional 5.2% |
| Macedonians | 99.8 /100 | #67 | Exceptional 5.2% |
| Immigrants | Syria | 99.7 /100 | #68 | Exceptional 5.2% |
| Guyanese | 99.7 /100 | #69 | Exceptional 5.2% |
| Immigrants | Belgium | 99.7 /100 | #70 | Exceptional 5.2% |
| Jordanians | 99.7 /100 | #71 | Exceptional 5.2% |
| Immigrants | Vietnam | 99.7 /100 | #72 | Exceptional 5.2% |
| Immigrants | Czechoslovakia | 99.7 /100 | #73 | Exceptional 5.2% |
| Immigrants | Romania | 99.7 /100 | #74 | Exceptional 5.2% |
| Immigrants | Moldova | 99.6 /100 | #75 | Exceptional 5.2% |
| Immigrants | Guyana | 99.6 /100 | #76 | Exceptional 5.2% |
Demographics Similar to Immigrants from the Azores by Disability Age 5 to 17
In terms of disability age 5 to 17, the demographic groups most similar to Immigrants from the Azores are French Canadian (6.7%, a difference of 0.020%), Dutch West Indian (6.7%, a difference of 0.10%), Black/African American (6.8%, a difference of 0.59%), Seminole (6.8%, a difference of 0.64%), and Ottawa (6.8%, a difference of 1.3%).
| Demographics | Rating | Rank | Disability Age 5 to 17 |
| Americans | 0.0 /100 | #325 | Tragic 6.5% |
| Potawatomi | 0.0 /100 | #326 | Tragic 6.5% |
| French American Indians | 0.0 /100 | #327 | Tragic 6.6% |
| Pennsylvania Germans | 0.0 /100 | #328 | Tragic 6.6% |
| Blackfeet | 0.0 /100 | #329 | Tragic 6.6% |
| Dutch West Indians | 0.0 /100 | #330 | Tragic 6.7% |
| French Canadians | 0.0 /100 | #331 | Tragic 6.7% |
| Immigrants | Azores | 0.0 /100 | #332 | Tragic 6.7% |
| Blacks/African Americans | 0.0 /100 | #333 | Tragic 6.8% |
| Seminole | 0.0 /100 | #334 | Tragic 6.8% |
| Ottawa | 0.0 /100 | #335 | Tragic 6.8% |
| Chickasaw | 0.0 /100 | #336 | Tragic 6.8% |
| Creek | 0.0 /100 | #337 | Tragic 6.9% |
| Iroquois | 0.0 /100 | #338 | Tragic 6.9% |
| Choctaw | 0.0 /100 | #339 | Tragic 6.9% |