Guyanese vs Danish Disability Age 5 to 17
COMPARE
Guyanese
Danish
Disability Age 5 to 17
Disability Age 5 to 17 Comparison
Guyanese
Danes
5.2%
DISABILITY AGE 5 TO 17
99.7/ 100
METRIC RATING
69th/ 347
METRIC RANK
5.7%
DISABILITY AGE 5 TO 17
26.5/ 100
METRIC RATING
191st/ 347
METRIC RANK
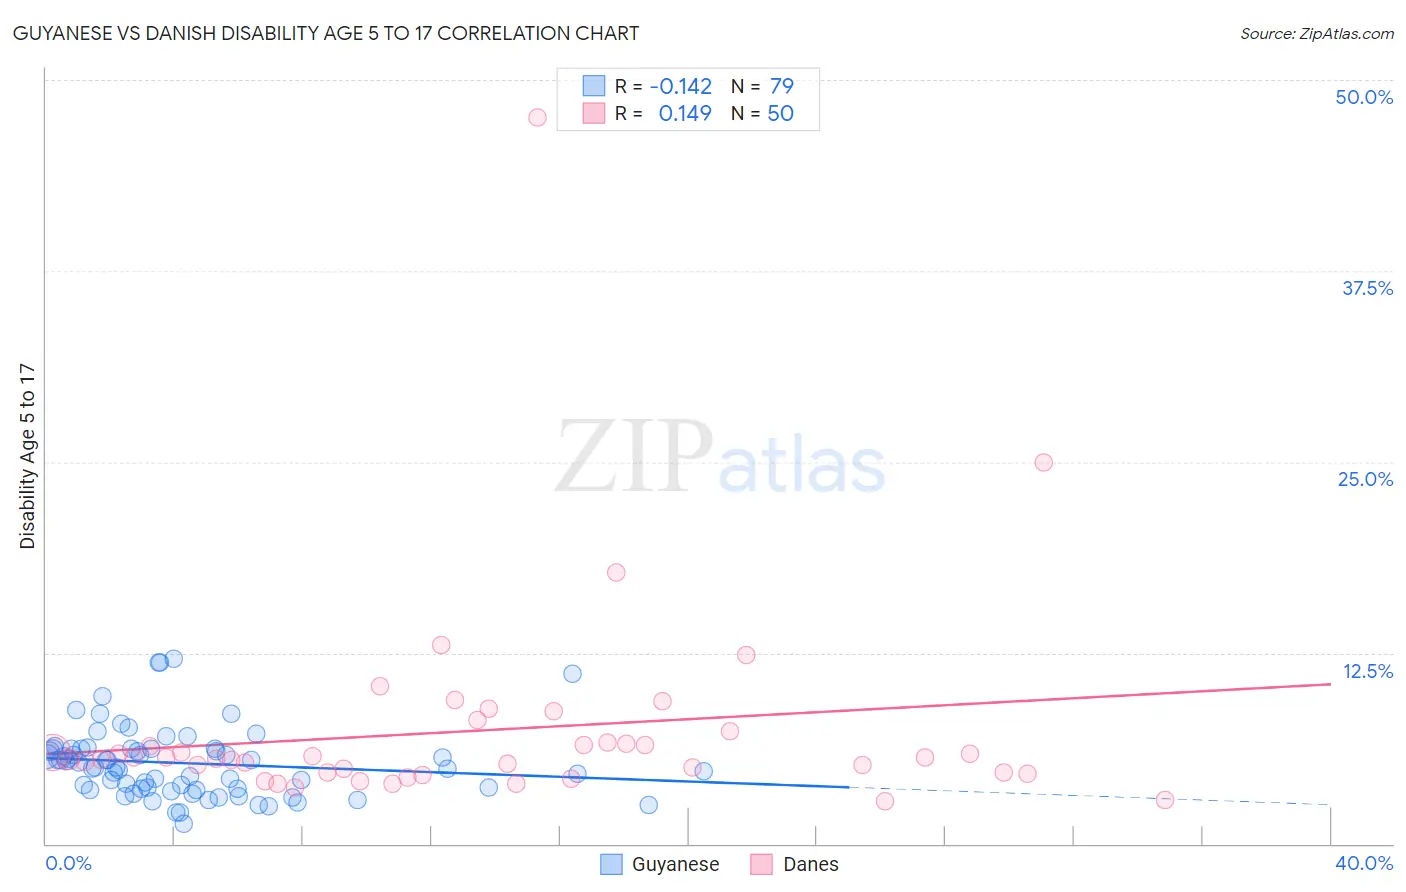
Guyanese vs Danish Disability Age 5 to 17 Correlation Chart
The statistical analysis conducted on geographies consisting of 176,238,096 people shows a poor negative correlation between the proportion of Guyanese and percentage of population with a disability between the ages 5 and 17 in the United States with a correlation coefficient (R) of -0.142 and weighted average of 5.2%. Similarly, the statistical analysis conducted on geographies consisting of 467,230,380 people shows a poor positive correlation between the proportion of Danes and percentage of population with a disability between the ages 5 and 17 in the United States with a correlation coefficient (R) of 0.149 and weighted average of 5.7%, a difference of 9.2%.
Disability Age 5 to 17 Correlation Summary
| Measurement | Guyanese | Danish |
| Minimum | 1.3% | 2.8% |
| Maximum | 12.1% | 47.6% |
| Range | 10.8% | 44.8% |
| Mean | 5.3% | 7.4% |
| Median | 5.0% | 5.6% |
| Interquartile 25% (IQ1) | 3.6% | 4.7% |
| Interquartile 75% (IQ3) | 6.2% | 6.6% |
| Interquartile Range (IQR) | 2.6% | 1.9% |
| Standard Deviation (Sample) | 2.3% | 6.9% |
| Standard Deviation (Population) | 2.3% | 6.9% |
Similar Demographics by Disability Age 5 to 17
Demographics Similar to Guyanese by Disability Age 5 to 17
In terms of disability age 5 to 17, the demographic groups most similar to Guyanese are Immigrants from Belgium (5.2%, a difference of 0.040%), Jordanian (5.2%, a difference of 0.080%), Immigrants from Syria (5.2%, a difference of 0.11%), Immigrants from Vietnam (5.2%, a difference of 0.11%), and Immigrants from Czechoslovakia (5.2%, a difference of 0.13%).
| Demographics | Rating | Rank | Disability Age 5 to 17 |
| Immigrants | Ireland | 99.8 /100 | #62 | Exceptional 5.2% |
| Immigrants | Bangladesh | 99.8 /100 | #63 | Exceptional 5.2% |
| Immigrants | South Eastern Asia | 99.8 /100 | #64 | Exceptional 5.2% |
| Immigrants | Greece | 99.8 /100 | #65 | Exceptional 5.2% |
| Palestinians | 99.8 /100 | #66 | Exceptional 5.2% |
| Macedonians | 99.8 /100 | #67 | Exceptional 5.2% |
| Immigrants | Syria | 99.7 /100 | #68 | Exceptional 5.2% |
| Guyanese | 99.7 /100 | #69 | Exceptional 5.2% |
| Immigrants | Belgium | 99.7 /100 | #70 | Exceptional 5.2% |
| Jordanians | 99.7 /100 | #71 | Exceptional 5.2% |
| Immigrants | Vietnam | 99.7 /100 | #72 | Exceptional 5.2% |
| Immigrants | Czechoslovakia | 99.7 /100 | #73 | Exceptional 5.2% |
| Immigrants | Romania | 99.7 /100 | #74 | Exceptional 5.2% |
| Immigrants | Moldova | 99.6 /100 | #75 | Exceptional 5.2% |
| Immigrants | Guyana | 99.6 /100 | #76 | Exceptional 5.2% |
Demographics Similar to Danes by Disability Age 5 to 17
In terms of disability age 5 to 17, the demographic groups most similar to Danes are Immigrants from Bosnia and Herzegovina (5.7%, a difference of 0.010%), Immigrants from Canada (5.7%, a difference of 0.030%), Immigrants from Eastern Africa (5.7%, a difference of 0.050%), Pueblo (5.7%, a difference of 0.060%), and Marshallese (5.7%, a difference of 0.10%).
| Demographics | Rating | Rank | Disability Age 5 to 17 |
| Syrians | 33.8 /100 | #184 | Fair 5.6% |
| Immigrants | Mexico | 33.7 /100 | #185 | Fair 5.6% |
| Fijians | 31.7 /100 | #186 | Fair 5.7% |
| Immigrants | Thailand | 30.2 /100 | #187 | Fair 5.7% |
| Marshallese | 28.1 /100 | #188 | Fair 5.7% |
| Pueblo | 27.5 /100 | #189 | Fair 5.7% |
| Immigrants | Eastern Africa | 27.3 /100 | #190 | Fair 5.7% |
| Danes | 26.5 /100 | #191 | Fair 5.7% |
| Immigrants | Bosnia and Herzegovina | 26.3 /100 | #192 | Fair 5.7% |
| Immigrants | Canada | 26.1 /100 | #193 | Fair 5.7% |
| Croatians | 23.6 /100 | #194 | Fair 5.7% |
| Immigrants | Nigeria | 23.4 /100 | #195 | Fair 5.7% |
| Inupiat | 23.3 /100 | #196 | Fair 5.7% |
| Immigrants | North America | 23.1 /100 | #197 | Fair 5.7% |
| Norwegians | 20.9 /100 | #198 | Fair 5.7% |