Guyanese vs Immigrants from the Azores Per Capita Income
COMPARE
Guyanese
Immigrants from the Azores
Per Capita Income
Per Capita Income Comparison
Guyanese
Immigrants from the Azores
$40,949
PER CAPITA INCOME
4.5/ 100
METRIC RATING
232nd/ 347
METRIC RANK
$39,608
PER CAPITA INCOME
1.0/ 100
METRIC RATING
252nd/ 347
METRIC RANK
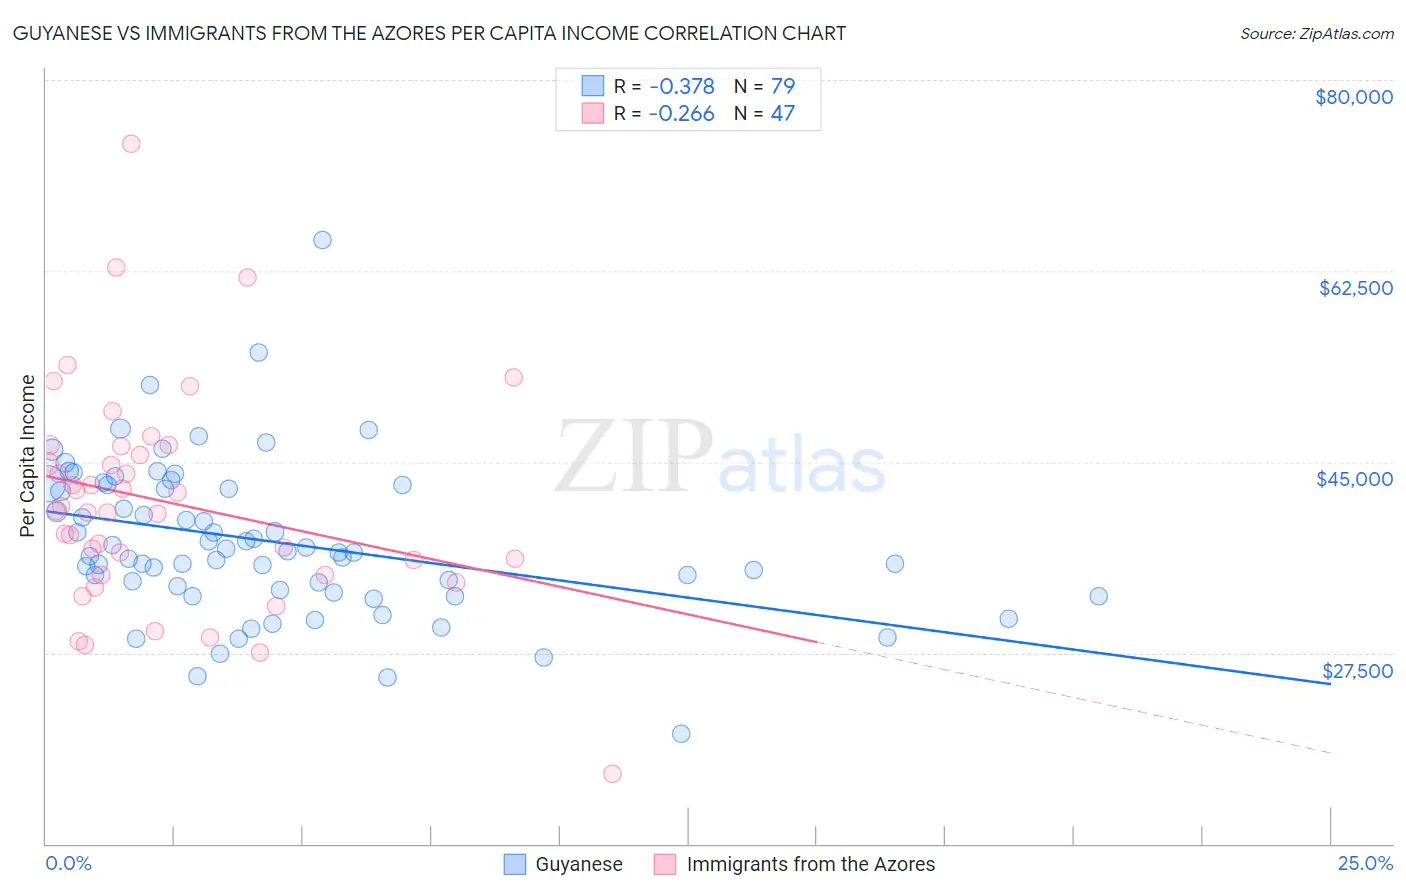
Guyanese vs Immigrants from the Azores Per Capita Income Correlation Chart
The statistical analysis conducted on geographies consisting of 176,945,802 people shows a mild negative correlation between the proportion of Guyanese and per capita income in the United States with a correlation coefficient (R) of -0.378 and weighted average of $40,949. Similarly, the statistical analysis conducted on geographies consisting of 46,254,060 people shows a weak negative correlation between the proportion of Immigrants from the Azores and per capita income in the United States with a correlation coefficient (R) of -0.266 and weighted average of $39,608, a difference of 3.4%.
Per Capita Income Correlation Summary
| Measurement | Guyanese | Immigrants from the Azores |
| Minimum | $20,131 | $16,377 |
| Maximum | $65,314 | $74,187 |
| Range | $45,183 | $57,810 |
| Mean | $37,694 | $41,323 |
| Median | $36,719 | $40,470 |
| Interquartile 25% (IQ1) | $33,285 | $34,672 |
| Interquartile 75% (IQ3) | $42,829 | $46,446 |
| Interquartile Range (IQR) | $9,544 | $11,774 |
| Standard Deviation (Sample) | $7,132 | $10,106 |
| Standard Deviation (Population) | $7,087 | $9,998 |
Demographics Similar to Guyanese and Immigrants from the Azores by Per Capita Income
In terms of per capita income, the demographic groups most similar to Guyanese are Delaware ($40,778, a difference of 0.42%), Immigrants from West Indies ($40,763, a difference of 0.46%), Immigrants from Guyana ($40,742, a difference of 0.51%), Nonimmigrants ($40,669, a difference of 0.69%), and Immigrants from Cambodia ($40,434, a difference of 1.3%). Similarly, the demographic groups most similar to Immigrants from the Azores are Immigrants from Burma/Myanmar ($39,827, a difference of 0.55%), Samoan ($39,826, a difference of 0.55%), Japanese ($39,870, a difference of 0.66%), Cape Verdean ($39,935, a difference of 0.83%), and Immigrants from Somalia ($39,974, a difference of 0.92%).
| Demographics | Rating | Rank | Per Capita Income |
| Guyanese | 4.5 /100 | #232 | Tragic $40,949 |
| Delaware | 3.8 /100 | #233 | Tragic $40,778 |
| Immigrants | West Indies | 3.7 /100 | #234 | Tragic $40,763 |
| Immigrants | Guyana | 3.6 /100 | #235 | Tragic $40,742 |
| Immigrants | Nonimmigrants | 3.4 /100 | #236 | Tragic $40,669 |
| Immigrants | Cambodia | 2.6 /100 | #237 | Tragic $40,434 |
| Somalis | 2.4 /100 | #238 | Tragic $40,367 |
| Tsimshian | 2.4 /100 | #239 | Tragic $40,344 |
| Immigrants | Nigeria | 2.3 /100 | #240 | Tragic $40,339 |
| British West Indians | 2.3 /100 | #241 | Tragic $40,330 |
| Immigrants | Western Africa | 2.2 /100 | #242 | Tragic $40,294 |
| German Russians | 2.2 /100 | #243 | Tragic $40,266 |
| French American Indians | 2.1 /100 | #244 | Tragic $40,244 |
| Sub-Saharan Africans | 1.9 /100 | #245 | Tragic $40,152 |
| Cree | 1.7 /100 | #246 | Tragic $40,056 |
| Immigrants | Somalia | 1.6 /100 | #247 | Tragic $39,974 |
| Cape Verdeans | 1.5 /100 | #248 | Tragic $39,935 |
| Japanese | 1.4 /100 | #249 | Tragic $39,870 |
| Immigrants | Burma/Myanmar | 1.3 /100 | #250 | Tragic $39,827 |
| Samoans | 1.3 /100 | #251 | Tragic $39,826 |
| Immigrants | Azores | 1.0 /100 | #252 | Tragic $39,608 |