Ethiopian vs Immigrants from the Azores Disability Age 5 to 17
COMPARE
Ethiopian
Immigrants from the Azores
Disability Age 5 to 17
Disability Age 5 to 17 Comparison
Ethiopians
Immigrants from the Azores
5.3%
DISABILITY AGE 5 TO 17
97.9/ 100
METRIC RATING
111th/ 347
METRIC RANK
6.7%
DISABILITY AGE 5 TO 17
0.0/ 100
METRIC RATING
332nd/ 347
METRIC RANK
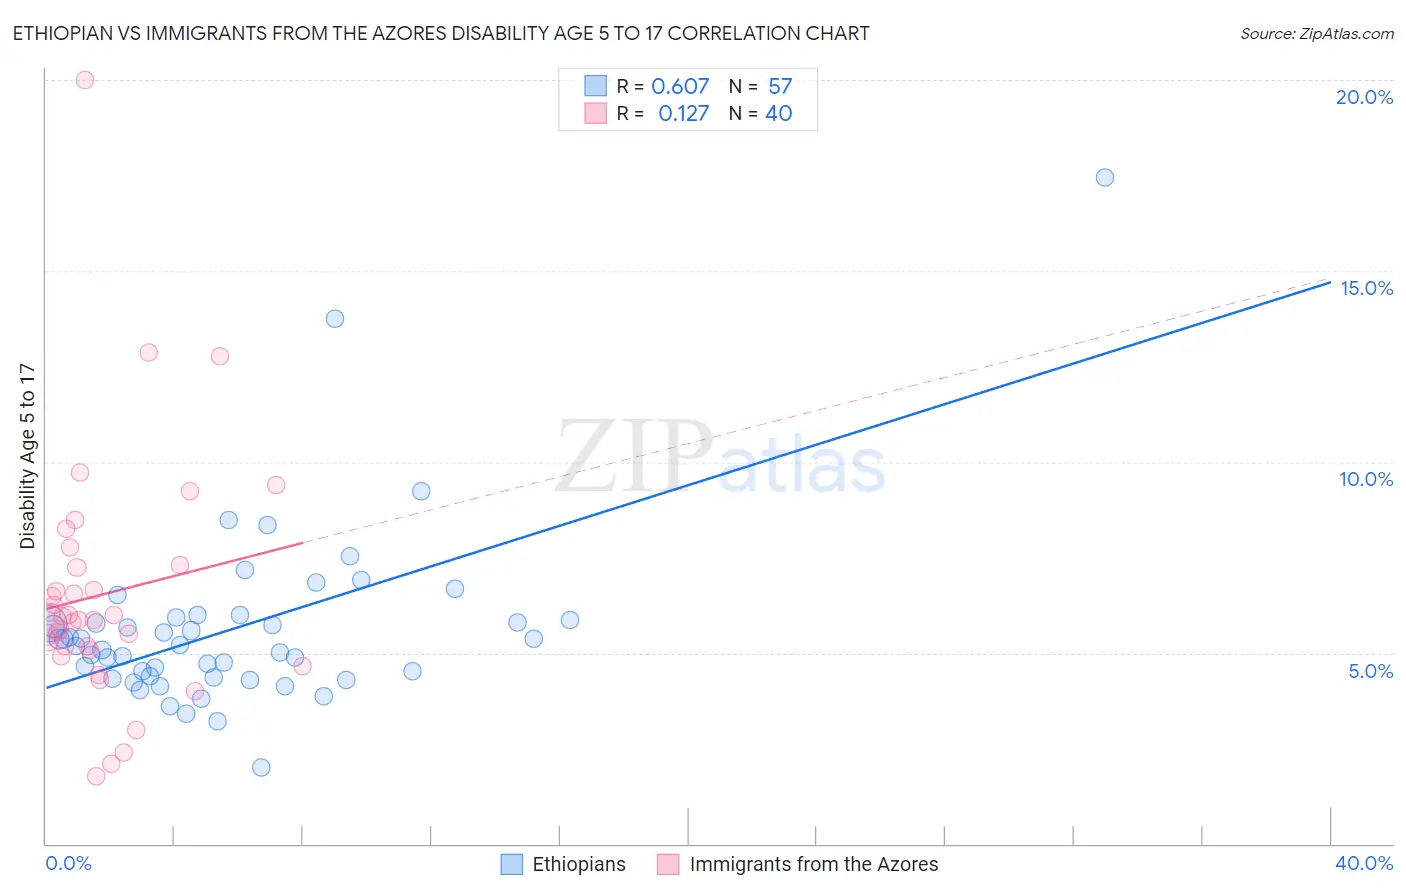
Ethiopian vs Immigrants from the Azores Disability Age 5 to 17 Correlation Chart
The statistical analysis conducted on geographies consisting of 222,418,387 people shows a significant positive correlation between the proportion of Ethiopians and percentage of population with a disability between the ages 5 and 17 in the United States with a correlation coefficient (R) of 0.607 and weighted average of 5.3%. Similarly, the statistical analysis conducted on geographies consisting of 46,157,711 people shows a poor positive correlation between the proportion of Immigrants from the Azores and percentage of population with a disability between the ages 5 and 17 in the United States with a correlation coefficient (R) of 0.127 and weighted average of 6.7%, a difference of 25.9%.
Disability Age 5 to 17 Correlation Summary
| Measurement | Ethiopian | Immigrants from the Azores |
| Minimum | 2.0% | 1.8% |
| Maximum | 17.5% | 20.0% |
| Range | 15.4% | 18.2% |
| Mean | 5.6% | 6.5% |
| Median | 5.2% | 5.9% |
| Interquartile 25% (IQ1) | 4.4% | 5.1% |
| Interquartile 75% (IQ3) | 5.9% | 7.3% |
| Interquartile Range (IQR) | 1.5% | 2.1% |
| Standard Deviation (Sample) | 2.3% | 3.2% |
| Standard Deviation (Population) | 2.3% | 3.2% |
Similar Demographics by Disability Age 5 to 17
Demographics Similar to Ethiopians by Disability Age 5 to 17
In terms of disability age 5 to 17, the demographic groups most similar to Ethiopians are Immigrants from Latvia (5.3%, a difference of 0.020%), Immigrants from Eritrea (5.3%, a difference of 0.040%), Aleut (5.3%, a difference of 0.060%), Immigrants from Northern Africa (5.3%, a difference of 0.080%), and Immigrants from Northern Europe (5.3%, a difference of 0.090%).
| Demographics | Rating | Rank | Disability Age 5 to 17 |
| Peruvians | 98.5 /100 | #104 | Exceptional 5.3% |
| Immigrants | Italy | 98.4 /100 | #105 | Exceptional 5.3% |
| Immigrants | Yemen | 98.2 /100 | #106 | Exceptional 5.3% |
| Russians | 98.2 /100 | #107 | Exceptional 5.3% |
| Immigrants | South Africa | 98.1 /100 | #108 | Exceptional 5.3% |
| Immigrants | Northern Africa | 98.1 /100 | #109 | Exceptional 5.3% |
| Immigrants | Eritrea | 98.0 /100 | #110 | Exceptional 5.3% |
| Ethiopians | 97.9 /100 | #111 | Exceptional 5.3% |
| Immigrants | Latvia | 97.9 /100 | #112 | Exceptional 5.3% |
| Aleuts | 97.8 /100 | #113 | Exceptional 5.3% |
| Immigrants | Northern Europe | 97.8 /100 | #114 | Exceptional 5.3% |
| Cubans | 97.8 /100 | #115 | Exceptional 5.3% |
| Cypriots | 97.7 /100 | #116 | Exceptional 5.3% |
| Immigrants | Afghanistan | 97.4 /100 | #117 | Exceptional 5.3% |
| South Americans | 97.1 /100 | #118 | Exceptional 5.4% |
Demographics Similar to Immigrants from the Azores by Disability Age 5 to 17
In terms of disability age 5 to 17, the demographic groups most similar to Immigrants from the Azores are French Canadian (6.7%, a difference of 0.020%), Dutch West Indian (6.7%, a difference of 0.10%), Black/African American (6.8%, a difference of 0.59%), Seminole (6.8%, a difference of 0.64%), and Ottawa (6.8%, a difference of 1.3%).
| Demographics | Rating | Rank | Disability Age 5 to 17 |
| Americans | 0.0 /100 | #325 | Tragic 6.5% |
| Potawatomi | 0.0 /100 | #326 | Tragic 6.5% |
| French American Indians | 0.0 /100 | #327 | Tragic 6.6% |
| Pennsylvania Germans | 0.0 /100 | #328 | Tragic 6.6% |
| Blackfeet | 0.0 /100 | #329 | Tragic 6.6% |
| Dutch West Indians | 0.0 /100 | #330 | Tragic 6.7% |
| French Canadians | 0.0 /100 | #331 | Tragic 6.7% |
| Immigrants | Azores | 0.0 /100 | #332 | Tragic 6.7% |
| Blacks/African Americans | 0.0 /100 | #333 | Tragic 6.8% |
| Seminole | 0.0 /100 | #334 | Tragic 6.8% |
| Ottawa | 0.0 /100 | #335 | Tragic 6.8% |
| Chickasaw | 0.0 /100 | #336 | Tragic 6.8% |
| Creek | 0.0 /100 | #337 | Tragic 6.9% |
| Iroquois | 0.0 /100 | #338 | Tragic 6.9% |
| Choctaw | 0.0 /100 | #339 | Tragic 6.9% |