Guyanese vs Kenyan Disability Age 5 to 17
COMPARE
Guyanese
Kenyan
Disability Age 5 to 17
Disability Age 5 to 17 Comparison
Guyanese
Kenyans
5.2%
DISABILITY AGE 5 TO 17
99.7/ 100
METRIC RATING
69th/ 347
METRIC RANK
5.8%
DISABILITY AGE 5 TO 17
10.0/ 100
METRIC RATING
208th/ 347
METRIC RANK
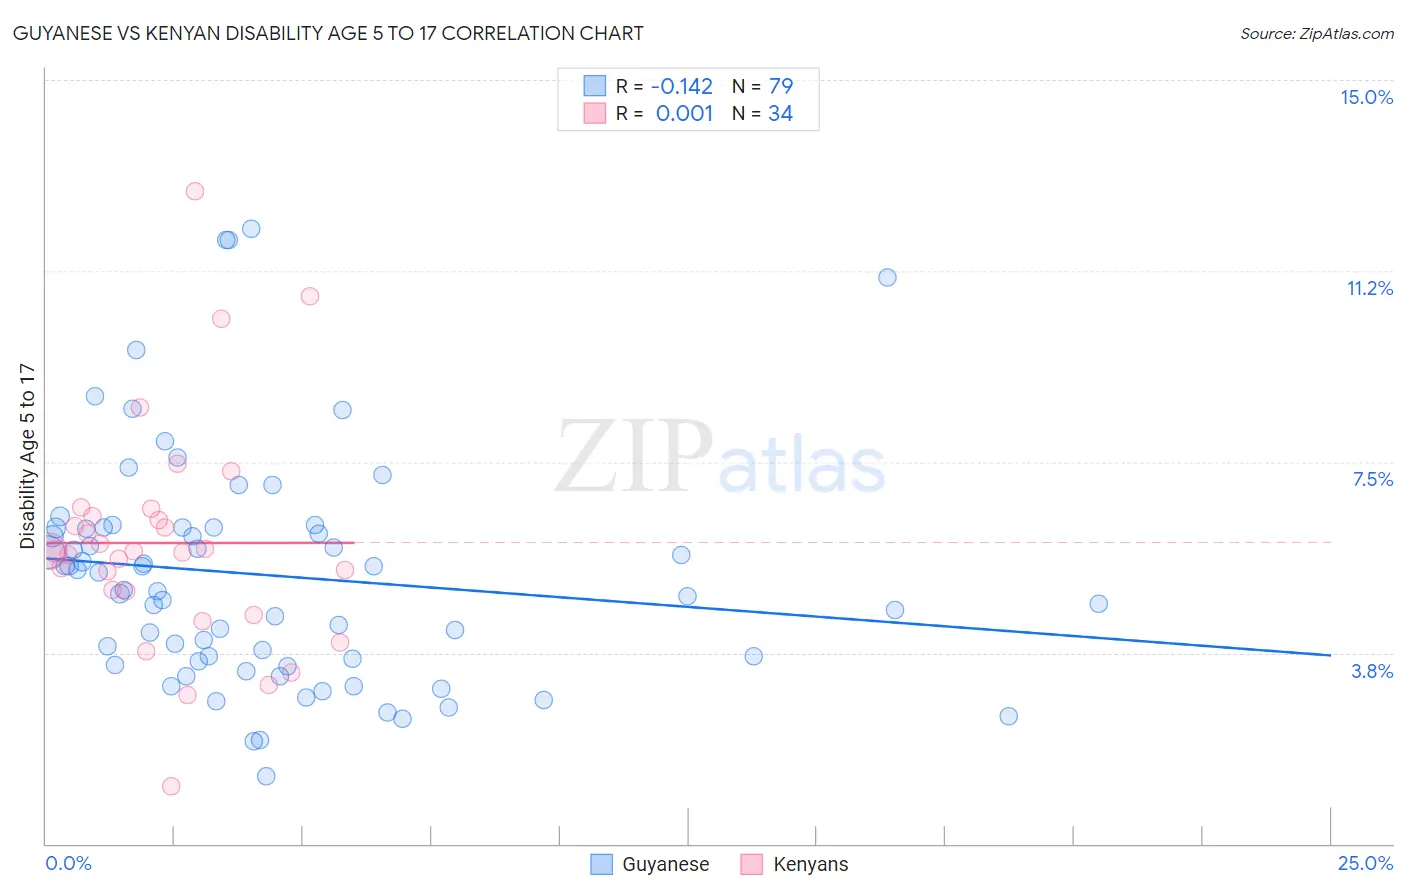
Guyanese vs Kenyan Disability Age 5 to 17 Correlation Chart
The statistical analysis conducted on geographies consisting of 176,238,096 people shows a poor negative correlation between the proportion of Guyanese and percentage of population with a disability between the ages 5 and 17 in the United States with a correlation coefficient (R) of -0.142 and weighted average of 5.2%. Similarly, the statistical analysis conducted on geographies consisting of 167,701,588 people shows no correlation between the proportion of Kenyans and percentage of population with a disability between the ages 5 and 17 in the United States with a correlation coefficient (R) of 0.001 and weighted average of 5.8%, a difference of 10.7%.
Disability Age 5 to 17 Correlation Summary
| Measurement | Guyanese | Kenyan |
| Minimum | 1.3% | 1.1% |
| Maximum | 12.1% | 12.8% |
| Range | 10.8% | 11.7% |
| Mean | 5.3% | 5.9% |
| Median | 5.0% | 5.7% |
| Interquartile 25% (IQ1) | 3.6% | 5.0% |
| Interquartile 75% (IQ3) | 6.2% | 6.4% |
| Interquartile Range (IQR) | 2.6% | 1.5% |
| Standard Deviation (Sample) | 2.3% | 2.2% |
| Standard Deviation (Population) | 2.3% | 2.2% |
Similar Demographics by Disability Age 5 to 17
Demographics Similar to Guyanese by Disability Age 5 to 17
In terms of disability age 5 to 17, the demographic groups most similar to Guyanese are Immigrants from Belgium (5.2%, a difference of 0.040%), Jordanian (5.2%, a difference of 0.080%), Immigrants from Syria (5.2%, a difference of 0.11%), Immigrants from Vietnam (5.2%, a difference of 0.11%), and Immigrants from Czechoslovakia (5.2%, a difference of 0.13%).
| Demographics | Rating | Rank | Disability Age 5 to 17 |
| Immigrants | Ireland | 99.8 /100 | #62 | Exceptional 5.2% |
| Immigrants | Bangladesh | 99.8 /100 | #63 | Exceptional 5.2% |
| Immigrants | South Eastern Asia | 99.8 /100 | #64 | Exceptional 5.2% |
| Immigrants | Greece | 99.8 /100 | #65 | Exceptional 5.2% |
| Palestinians | 99.8 /100 | #66 | Exceptional 5.2% |
| Macedonians | 99.8 /100 | #67 | Exceptional 5.2% |
| Immigrants | Syria | 99.7 /100 | #68 | Exceptional 5.2% |
| Guyanese | 99.7 /100 | #69 | Exceptional 5.2% |
| Immigrants | Belgium | 99.7 /100 | #70 | Exceptional 5.2% |
| Jordanians | 99.7 /100 | #71 | Exceptional 5.2% |
| Immigrants | Vietnam | 99.7 /100 | #72 | Exceptional 5.2% |
| Immigrants | Czechoslovakia | 99.7 /100 | #73 | Exceptional 5.2% |
| Immigrants | Romania | 99.7 /100 | #74 | Exceptional 5.2% |
| Immigrants | Moldova | 99.6 /100 | #75 | Exceptional 5.2% |
| Immigrants | Guyana | 99.6 /100 | #76 | Exceptional 5.2% |
Demographics Similar to Kenyans by Disability Age 5 to 17
In terms of disability age 5 to 17, the demographic groups most similar to Kenyans are Immigrants from Uganda (5.8%, a difference of 0.040%), Moroccan (5.7%, a difference of 0.050%), Immigrants from Haiti (5.8%, a difference of 0.070%), Trinidadian and Tobagonian (5.7%, a difference of 0.10%), and Immigrants from Africa (5.7%, a difference of 0.10%).
| Demographics | Rating | Rank | Disability Age 5 to 17 |
| Basques | 13.7 /100 | #201 | Poor 5.7% |
| Austrians | 13.2 /100 | #202 | Poor 5.7% |
| Spanish American Indians | 12.8 /100 | #203 | Poor 5.7% |
| Paiute | 11.2 /100 | #204 | Poor 5.7% |
| Trinidadians and Tobagonians | 10.8 /100 | #205 | Poor 5.7% |
| Immigrants | Africa | 10.8 /100 | #206 | Poor 5.7% |
| Moroccans | 10.4 /100 | #207 | Poor 5.7% |
| Kenyans | 10.0 /100 | #208 | Poor 5.8% |
| Immigrants | Uganda | 9.7 /100 | #209 | Tragic 5.8% |
| Immigrants | Haiti | 9.5 /100 | #210 | Tragic 5.8% |
| Yugoslavians | 9.1 /100 | #211 | Tragic 5.8% |
| Immigrants | Panama | 8.7 /100 | #212 | Tragic 5.8% |
| Immigrants | Cameroon | 8.3 /100 | #213 | Tragic 5.8% |
| Immigrants | Morocco | 8.3 /100 | #214 | Tragic 5.8% |
| Swedes | 8.1 /100 | #215 | Tragic 5.8% |