Guamanian/Chamorro vs Spaniard 2nd Grade
COMPARE
Guamanian/Chamorro
Spaniard
2nd Grade
2nd Grade Comparison
Guamanians/Chamorros
Spaniards
97.8%
2ND GRADE
25.7/ 100
METRIC RATING
198th/ 347
METRIC RANK
98.0%
2ND GRADE
90.7/ 100
METRIC RATING
132nd/ 347
METRIC RANK
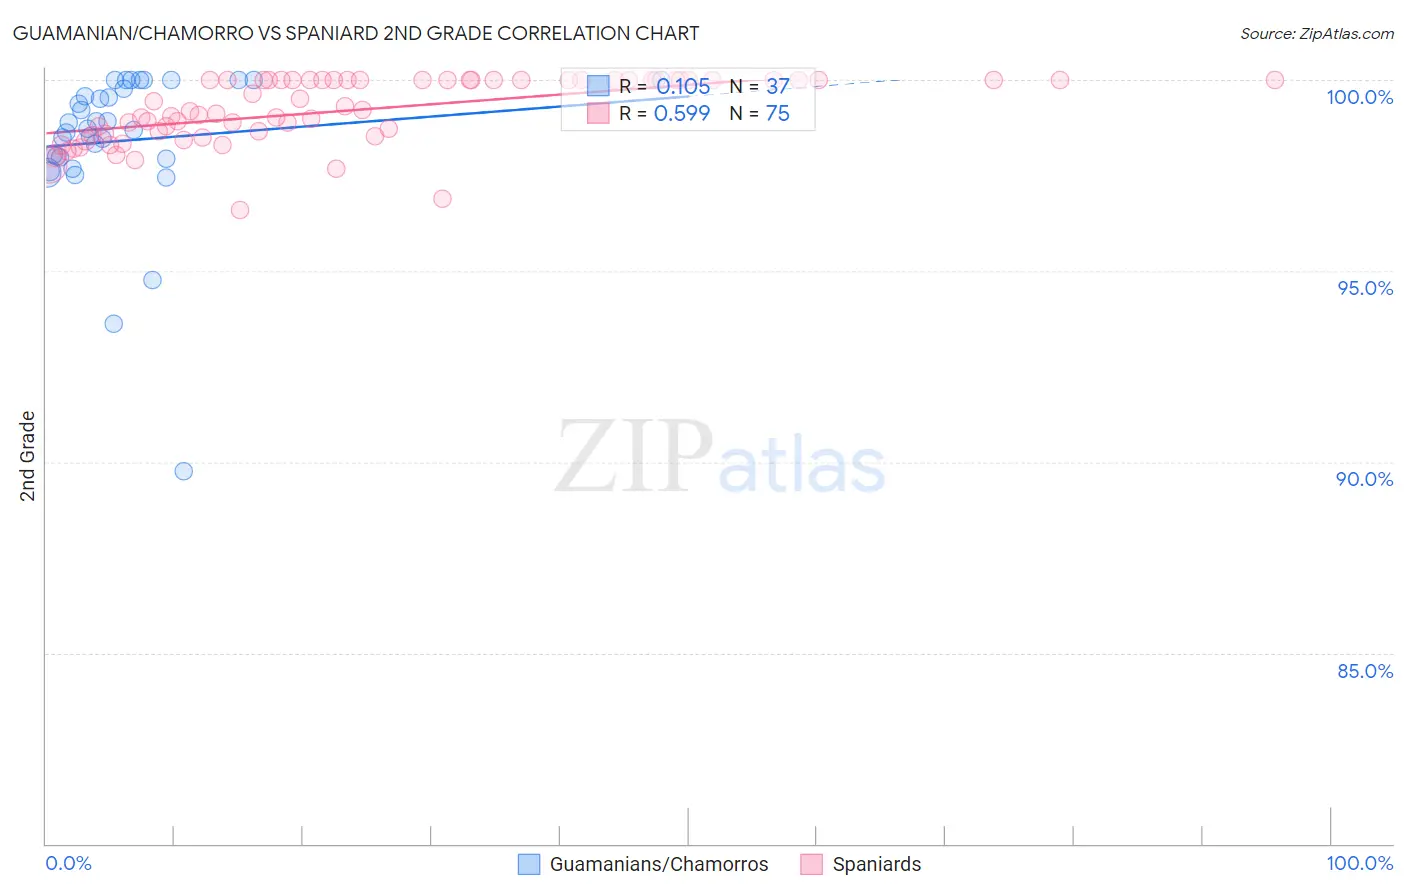
Guamanian/Chamorro vs Spaniard 2nd Grade Correlation Chart
The statistical analysis conducted on geographies consisting of 221,965,618 people shows a poor positive correlation between the proportion of Guamanians/Chamorros and percentage of population with at least 2nd grade education in the United States with a correlation coefficient (R) of 0.105 and weighted average of 97.8%. Similarly, the statistical analysis conducted on geographies consisting of 443,544,503 people shows a substantial positive correlation between the proportion of Spaniards and percentage of population with at least 2nd grade education in the United States with a correlation coefficient (R) of 0.599 and weighted average of 98.0%, a difference of 0.26%.
2nd Grade Correlation Summary
| Measurement | Guamanian/Chamorro | Spaniard |
| Minimum | 89.7% | 96.6% |
| Maximum | 100.0% | 100.0% |
| Range | 10.3% | 3.4% |
| Mean | 98.4% | 99.2% |
| Median | 98.7% | 99.2% |
| Interquartile 25% (IQ1) | 97.9% | 98.6% |
| Interquartile 75% (IQ3) | 99.9% | 100.0% |
| Interquartile Range (IQR) | 1.9% | 1.4% |
| Standard Deviation (Sample) | 2.0% | 0.85% |
| Standard Deviation (Population) | 2.0% | 0.84% |
Similar Demographics by 2nd Grade
Demographics Similar to Guamanians/Chamorros by 2nd Grade
In terms of 2nd grade, the demographic groups most similar to Guamanians/Chamorros are Mongolian (97.8%, a difference of 0.0%), Immigrants from Kenya (97.8%, a difference of 0.0%), Immigrants from Uganda (97.8%, a difference of 0.0%), Hawaiian (97.8%, a difference of 0.010%), and Paiute (97.8%, a difference of 0.010%).
| Demographics | Rating | Rank | 2nd Grade |
| Paraguayans | 30.8 /100 | #191 | Fair 97.8% |
| Blacks/African Americans | 29.9 /100 | #192 | Fair 97.8% |
| Hawaiians | 28.5 /100 | #193 | Fair 97.8% |
| Paiute | 27.0 /100 | #194 | Fair 97.8% |
| Mongolians | 26.7 /100 | #195 | Fair 97.8% |
| Immigrants | Kenya | 26.4 /100 | #196 | Fair 97.8% |
| Immigrants | Uganda | 26.3 /100 | #197 | Fair 97.8% |
| Guamanians/Chamorros | 25.7 /100 | #198 | Fair 97.8% |
| Immigrants | Egypt | 24.4 /100 | #199 | Fair 97.8% |
| Immigrants | Lebanon | 20.9 /100 | #200 | Fair 97.8% |
| Tohono O'odham | 20.9 /100 | #201 | Fair 97.8% |
| Immigrants | Ukraine | 20.5 /100 | #202 | Fair 97.8% |
| Yuman | 20.0 /100 | #203 | Fair 97.8% |
| Immigrants | Albania | 18.4 /100 | #204 | Poor 97.8% |
| Immigrants | Southern Europe | 18.1 /100 | #205 | Poor 97.8% |
Demographics Similar to Spaniards by 2nd Grade
In terms of 2nd grade, the demographic groups most similar to Spaniards are Seminole (98.0%, a difference of 0.0%), Immigrants from Europe (98.0%, a difference of 0.0%), Cambodian (98.0%, a difference of 0.0%), Immigrants from Croatia (98.1%, a difference of 0.010%), and Immigrants from Hungary (98.0%, a difference of 0.010%).
| Demographics | Rating | Rank | 2nd Grade |
| Iroquois | 94.1 /100 | #125 | Exceptional 98.1% |
| Syrians | 94.0 /100 | #126 | Exceptional 98.1% |
| Immigrants | Saudi Arabia | 93.6 /100 | #127 | Exceptional 98.1% |
| Immigrants | Serbia | 92.3 /100 | #128 | Exceptional 98.1% |
| Immigrants | Croatia | 92.1 /100 | #129 | Exceptional 98.1% |
| Seminole | 91.1 /100 | #130 | Exceptional 98.0% |
| Immigrants | Europe | 91.1 /100 | #131 | Exceptional 98.0% |
| Spaniards | 90.7 /100 | #132 | Exceptional 98.0% |
| Cambodians | 90.7 /100 | #133 | Exceptional 98.0% |
| Immigrants | Hungary | 89.7 /100 | #134 | Excellent 98.0% |
| Immigrants | Bulgaria | 89.7 /100 | #135 | Excellent 98.0% |
| Immigrants | Kuwait | 89.2 /100 | #136 | Excellent 98.0% |
| Immigrants | Romania | 88.3 /100 | #137 | Excellent 98.0% |
| Israelis | 87.9 /100 | #138 | Excellent 98.0% |
| Blackfeet | 87.5 /100 | #139 | Excellent 98.0% |