Guamanian/Chamorro vs Nicaraguan Cognitive Disability
COMPARE
Guamanian/Chamorro
Nicaraguan
Cognitive Disability
Cognitive Disability Comparison
Guamanians/Chamorros
Nicaraguans
17.9%
COGNITIVE DISABILITY
0.5/ 100
METRIC RATING
261st/ 347
METRIC RANK
17.0%
COGNITIVE DISABILITY
93.0/ 100
METRIC RATING
128th/ 347
METRIC RANK
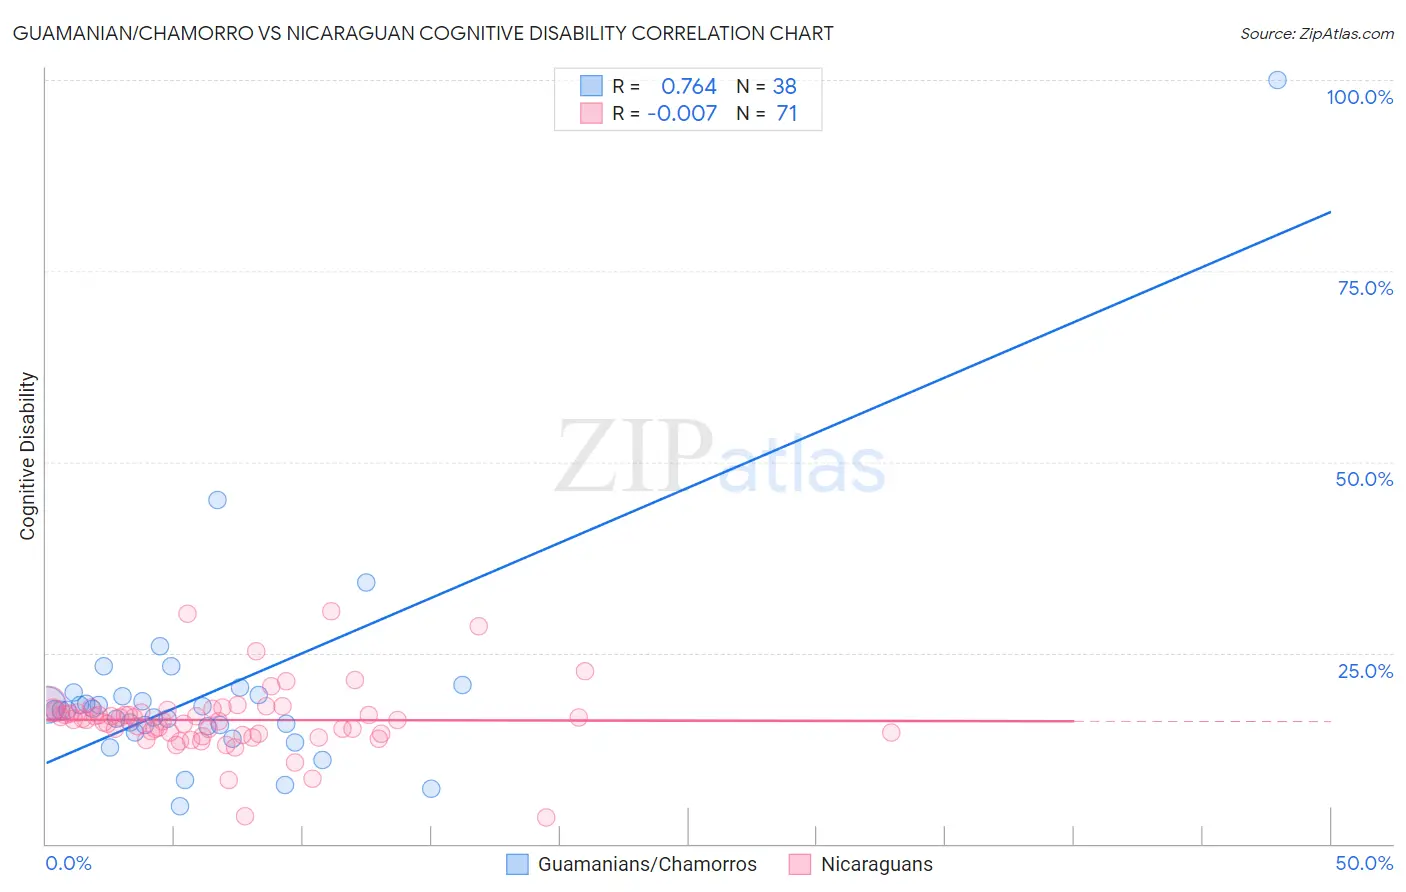
Guamanian/Chamorro vs Nicaraguan Cognitive Disability Correlation Chart
The statistical analysis conducted on geographies consisting of 221,888,944 people shows a strong positive correlation between the proportion of Guamanians/Chamorros and percentage of population with cognitive disability in the United States with a correlation coefficient (R) of 0.764 and weighted average of 17.9%. Similarly, the statistical analysis conducted on geographies consisting of 285,693,430 people shows no correlation between the proportion of Nicaraguans and percentage of population with cognitive disability in the United States with a correlation coefficient (R) of -0.007 and weighted average of 17.0%, a difference of 5.8%.
Cognitive Disability Correlation Summary
| Measurement | Guamanian/Chamorro | Nicaraguan |
| Minimum | 5.0% | 3.4% |
| Maximum | 100.0% | 30.4% |
| Range | 95.0% | 26.9% |
| Mean | 19.8% | 16.2% |
| Median | 17.5% | 16.2% |
| Interquartile 25% (IQ1) | 15.4% | 14.4% |
| Interquartile 75% (IQ3) | 19.5% | 17.4% |
| Interquartile Range (IQR) | 4.0% | 3.0% |
| Standard Deviation (Sample) | 15.1% | 4.4% |
| Standard Deviation (Population) | 14.9% | 4.4% |
Similar Demographics by Cognitive Disability
Demographics Similar to Guamanians/Chamorros by Cognitive Disability
In terms of cognitive disability, the demographic groups most similar to Guamanians/Chamorros are Sierra Leonean (17.9%, a difference of 0.030%), Immigrants from Belize (17.9%, a difference of 0.050%), Ethiopian (17.9%, a difference of 0.060%), Immigrants from Barbados (17.9%, a difference of 0.070%), and Menominee (18.0%, a difference of 0.13%).
| Demographics | Rating | Rank | Cognitive Disability |
| Hispanics or Latinos | 0.6 /100 | #254 | Tragic 17.9% |
| Immigrants | Azores | 0.6 /100 | #255 | Tragic 17.9% |
| Bahamians | 0.6 /100 | #256 | Tragic 17.9% |
| Mexican American Indians | 0.6 /100 | #257 | Tragic 17.9% |
| Immigrants | Armenia | 0.6 /100 | #258 | Tragic 17.9% |
| Ethiopians | 0.5 /100 | #259 | Tragic 17.9% |
| Immigrants | Belize | 0.5 /100 | #260 | Tragic 17.9% |
| Guamanians/Chamorros | 0.5 /100 | #261 | Tragic 17.9% |
| Sierra Leoneans | 0.4 /100 | #262 | Tragic 17.9% |
| Immigrants | Barbados | 0.4 /100 | #263 | Tragic 17.9% |
| Menominee | 0.4 /100 | #264 | Tragic 18.0% |
| Spanish Americans | 0.4 /100 | #265 | Tragic 18.0% |
| Belizeans | 0.4 /100 | #266 | Tragic 18.0% |
| Nepalese | 0.3 /100 | #267 | Tragic 18.0% |
| Cherokee | 0.3 /100 | #268 | Tragic 18.0% |
Demographics Similar to Nicaraguans by Cognitive Disability
In terms of cognitive disability, the demographic groups most similar to Nicaraguans are Immigrants from Costa Rica (17.0%, a difference of 0.010%), Immigrants from Uruguay (17.0%, a difference of 0.010%), European (17.0%, a difference of 0.050%), Immigrants from Vietnam (17.0%, a difference of 0.070%), and Immigrants from Germany (17.0%, a difference of 0.090%).
| Demographics | Rating | Rank | Cognitive Disability |
| Immigrants | China | 94.9 /100 | #121 | Exceptional 16.9% |
| Immigrants | Western Europe | 94.8 /100 | #122 | Exceptional 16.9% |
| Portuguese | 94.7 /100 | #123 | Exceptional 16.9% |
| Turks | 94.5 /100 | #124 | Exceptional 16.9% |
| Scandinavians | 94.1 /100 | #125 | Exceptional 16.9% |
| Europeans | 93.4 /100 | #126 | Exceptional 17.0% |
| Immigrants | Costa Rica | 93.1 /100 | #127 | Exceptional 17.0% |
| Nicaraguans | 93.0 /100 | #128 | Exceptional 17.0% |
| Immigrants | Uruguay | 92.9 /100 | #129 | Exceptional 17.0% |
| Immigrants | Vietnam | 92.4 /100 | #130 | Exceptional 17.0% |
| Immigrants | Germany | 92.1 /100 | #131 | Exceptional 17.0% |
| Whites/Caucasians | 92.1 /100 | #132 | Exceptional 17.0% |
| Immigrants | Jordan | 91.9 /100 | #133 | Exceptional 17.0% |
| Immigrants | Chile | 91.7 /100 | #134 | Exceptional 17.0% |
| Lebanese | 91.3 /100 | #135 | Exceptional 17.0% |