Guamanian/Chamorro vs French American Indian Cognitive Disability
COMPARE
Guamanian/Chamorro
French American Indian
Cognitive Disability
Cognitive Disability Comparison
Guamanians/Chamorros
French American Indians
17.9%
COGNITIVE DISABILITY
0.5/ 100
METRIC RATING
261st/ 347
METRIC RANK
17.9%
COGNITIVE DISABILITY
0.7/ 100
METRIC RATING
248th/ 347
METRIC RANK
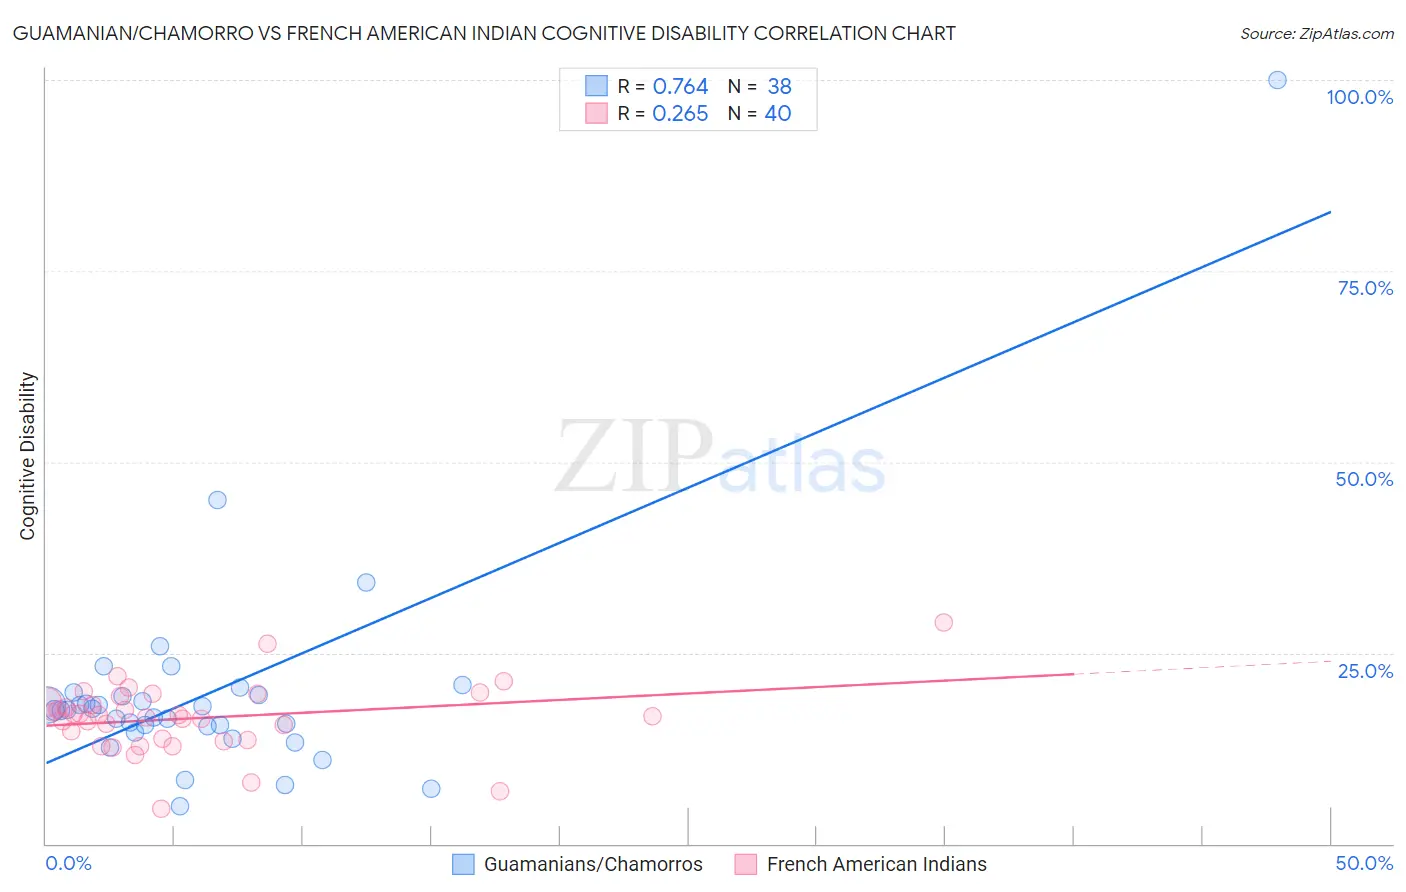
Guamanian/Chamorro vs French American Indian Cognitive Disability Correlation Chart
The statistical analysis conducted on geographies consisting of 221,888,944 people shows a strong positive correlation between the proportion of Guamanians/Chamorros and percentage of population with cognitive disability in the United States with a correlation coefficient (R) of 0.764 and weighted average of 17.9%. Similarly, the statistical analysis conducted on geographies consisting of 131,963,087 people shows a weak positive correlation between the proportion of French American Indians and percentage of population with cognitive disability in the United States with a correlation coefficient (R) of 0.265 and weighted average of 17.9%, a difference of 0.29%.
Cognitive Disability Correlation Summary
| Measurement | Guamanian/Chamorro | French American Indian |
| Minimum | 5.0% | 4.6% |
| Maximum | 100.0% | 28.9% |
| Range | 95.0% | 24.3% |
| Mean | 19.8% | 16.5% |
| Median | 17.5% | 16.7% |
| Interquartile 25% (IQ1) | 15.4% | 13.7% |
| Interquartile 75% (IQ3) | 19.5% | 19.0% |
| Interquartile Range (IQR) | 4.0% | 5.3% |
| Standard Deviation (Sample) | 15.1% | 4.5% |
| Standard Deviation (Population) | 14.9% | 4.5% |
Demographics Similar to Guamanians/Chamorros and French American Indians by Cognitive Disability
In terms of cognitive disability, the demographic groups most similar to Guamanians/Chamorros are Sierra Leonean (17.9%, a difference of 0.030%), Immigrants from Belize (17.9%, a difference of 0.050%), Ethiopian (17.9%, a difference of 0.060%), Immigrants from Barbados (17.9%, a difference of 0.070%), and Menominee (18.0%, a difference of 0.13%). Similarly, the demographic groups most similar to French American Indians are Samoan (17.9%, a difference of 0.010%), Cree (17.9%, a difference of 0.050%), Immigrants from Ethiopia (17.9%, a difference of 0.050%), Malaysian (17.9%, a difference of 0.060%), and Immigrants from Grenada (17.9%, a difference of 0.070%).
| Demographics | Rating | Rank | Cognitive Disability |
| Jamaicans | 0.9 /100 | #244 | Tragic 17.9% |
| Trinidadians and Tobagonians | 0.8 /100 | #245 | Tragic 17.9% |
| Immigrants | Thailand | 0.8 /100 | #246 | Tragic 17.9% |
| Samoans | 0.7 /100 | #247 | Tragic 17.9% |
| French American Indians | 0.7 /100 | #248 | Tragic 17.9% |
| Cree | 0.7 /100 | #249 | Tragic 17.9% |
| Immigrants | Ethiopia | 0.7 /100 | #250 | Tragic 17.9% |
| Malaysians | 0.6 /100 | #251 | Tragic 17.9% |
| Immigrants | Grenada | 0.6 /100 | #252 | Tragic 17.9% |
| Hopi | 0.6 /100 | #253 | Tragic 17.9% |
| Hispanics or Latinos | 0.6 /100 | #254 | Tragic 17.9% |
| Immigrants | Azores | 0.6 /100 | #255 | Tragic 17.9% |
| Bahamians | 0.6 /100 | #256 | Tragic 17.9% |
| Mexican American Indians | 0.6 /100 | #257 | Tragic 17.9% |
| Immigrants | Armenia | 0.6 /100 | #258 | Tragic 17.9% |
| Ethiopians | 0.5 /100 | #259 | Tragic 17.9% |
| Immigrants | Belize | 0.5 /100 | #260 | Tragic 17.9% |
| Guamanians/Chamorros | 0.5 /100 | #261 | Tragic 17.9% |
| Sierra Leoneans | 0.4 /100 | #262 | Tragic 17.9% |
| Immigrants | Barbados | 0.4 /100 | #263 | Tragic 17.9% |
| Menominee | 0.4 /100 | #264 | Tragic 18.0% |