Austrian vs Nicaraguan Cognitive Disability
COMPARE
Austrian
Nicaraguan
Cognitive Disability
Cognitive Disability Comparison
Austrians
Nicaraguans
16.6%
COGNITIVE DISABILITY
99.7/ 100
METRIC RATING
56th/ 347
METRIC RANK
17.0%
COGNITIVE DISABILITY
93.0/ 100
METRIC RATING
128th/ 347
METRIC RANK
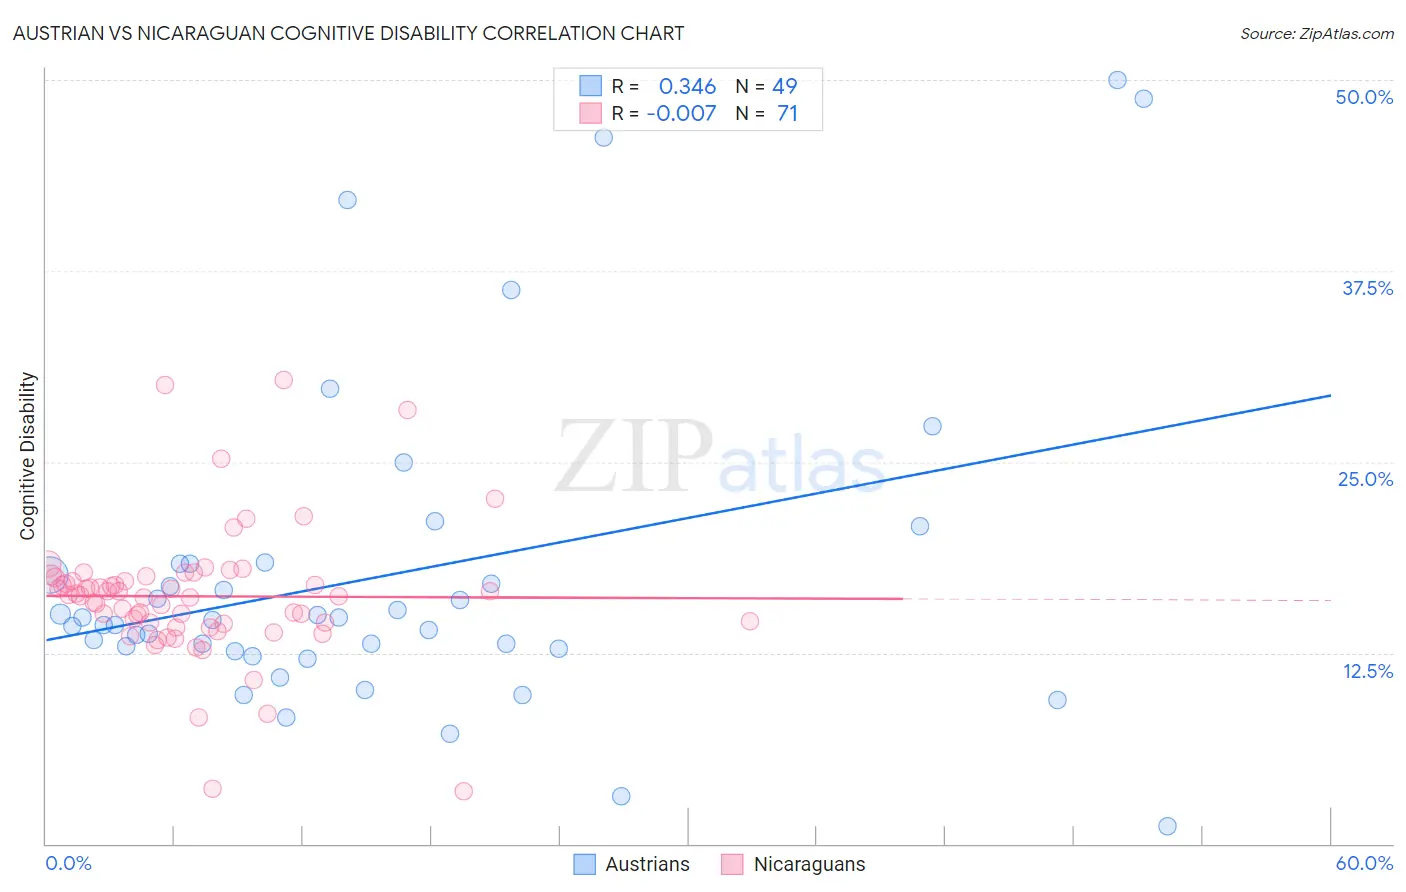
Austrian vs Nicaraguan Cognitive Disability Correlation Chart
The statistical analysis conducted on geographies consisting of 452,054,374 people shows a mild positive correlation between the proportion of Austrians and percentage of population with cognitive disability in the United States with a correlation coefficient (R) of 0.346 and weighted average of 16.6%. Similarly, the statistical analysis conducted on geographies consisting of 285,693,430 people shows no correlation between the proportion of Nicaraguans and percentage of population with cognitive disability in the United States with a correlation coefficient (R) of -0.007 and weighted average of 17.0%, a difference of 2.4%.
Cognitive Disability Correlation Summary
| Measurement | Austrian | Nicaraguan |
| Minimum | 1.2% | 3.4% |
| Maximum | 50.0% | 30.4% |
| Range | 48.8% | 26.9% |
| Mean | 17.6% | 16.2% |
| Median | 14.6% | 16.2% |
| Interquartile 25% (IQ1) | 12.7% | 14.4% |
| Interquartile 75% (IQ3) | 18.3% | 17.4% |
| Interquartile Range (IQR) | 5.6% | 3.0% |
| Standard Deviation (Sample) | 10.6% | 4.4% |
| Standard Deviation (Population) | 10.5% | 4.4% |
Similar Demographics by Cognitive Disability
Demographics Similar to Austrians by Cognitive Disability
In terms of cognitive disability, the demographic groups most similar to Austrians are Bhutanese (16.6%, a difference of 0.010%), Pennsylvania German (16.6%, a difference of 0.080%), Immigrants from Peru (16.6%, a difference of 0.080%), Immigrants from Venezuela (16.5%, a difference of 0.090%), and Romanian (16.6%, a difference of 0.090%).
| Demographics | Rating | Rank | Cognitive Disability |
| Iranians | 99.8 /100 | #49 | Exceptional 16.5% |
| Norwegians | 99.8 /100 | #50 | Exceptional 16.5% |
| Immigrants | Korea | 99.8 /100 | #51 | Exceptional 16.5% |
| Soviet Union | 99.8 /100 | #52 | Exceptional 16.5% |
| Swedes | 99.8 /100 | #53 | Exceptional 16.5% |
| Immigrants | Iran | 99.8 /100 | #54 | Exceptional 16.5% |
| Immigrants | Venezuela | 99.7 /100 | #55 | Exceptional 16.5% |
| Austrians | 99.7 /100 | #56 | Exceptional 16.6% |
| Bhutanese | 99.7 /100 | #57 | Exceptional 16.6% |
| Pennsylvania Germans | 99.7 /100 | #58 | Exceptional 16.6% |
| Immigrants | Peru | 99.7 /100 | #59 | Exceptional 16.6% |
| Romanians | 99.7 /100 | #60 | Exceptional 16.6% |
| Immigrants | England | 99.6 /100 | #61 | Exceptional 16.6% |
| Czechoslovakians | 99.6 /100 | #62 | Exceptional 16.6% |
| Argentineans | 99.6 /100 | #63 | Exceptional 16.6% |
Demographics Similar to Nicaraguans by Cognitive Disability
In terms of cognitive disability, the demographic groups most similar to Nicaraguans are Immigrants from Costa Rica (17.0%, a difference of 0.010%), Immigrants from Uruguay (17.0%, a difference of 0.010%), European (17.0%, a difference of 0.050%), Immigrants from Vietnam (17.0%, a difference of 0.070%), and Immigrants from Germany (17.0%, a difference of 0.090%).
| Demographics | Rating | Rank | Cognitive Disability |
| Immigrants | China | 94.9 /100 | #121 | Exceptional 16.9% |
| Immigrants | Western Europe | 94.8 /100 | #122 | Exceptional 16.9% |
| Portuguese | 94.7 /100 | #123 | Exceptional 16.9% |
| Turks | 94.5 /100 | #124 | Exceptional 16.9% |
| Scandinavians | 94.1 /100 | #125 | Exceptional 16.9% |
| Europeans | 93.4 /100 | #126 | Exceptional 17.0% |
| Immigrants | Costa Rica | 93.1 /100 | #127 | Exceptional 17.0% |
| Nicaraguans | 93.0 /100 | #128 | Exceptional 17.0% |
| Immigrants | Uruguay | 92.9 /100 | #129 | Exceptional 17.0% |
| Immigrants | Vietnam | 92.4 /100 | #130 | Exceptional 17.0% |
| Immigrants | Germany | 92.1 /100 | #131 | Exceptional 17.0% |
| Whites/Caucasians | 92.1 /100 | #132 | Exceptional 17.0% |
| Immigrants | Jordan | 91.9 /100 | #133 | Exceptional 17.0% |
| Immigrants | Chile | 91.7 /100 | #134 | Exceptional 17.0% |
| Lebanese | 91.3 /100 | #135 | Exceptional 17.0% |