Thai vs Nicaraguan Cognitive Disability
COMPARE
Thai
Nicaraguan
Cognitive Disability
Cognitive Disability Comparison
Thais
Nicaraguans
16.1%
COGNITIVE DISABILITY
100.0/ 100
METRIC RATING
6th/ 347
METRIC RANK
17.0%
COGNITIVE DISABILITY
93.0/ 100
METRIC RATING
128th/ 347
METRIC RANK
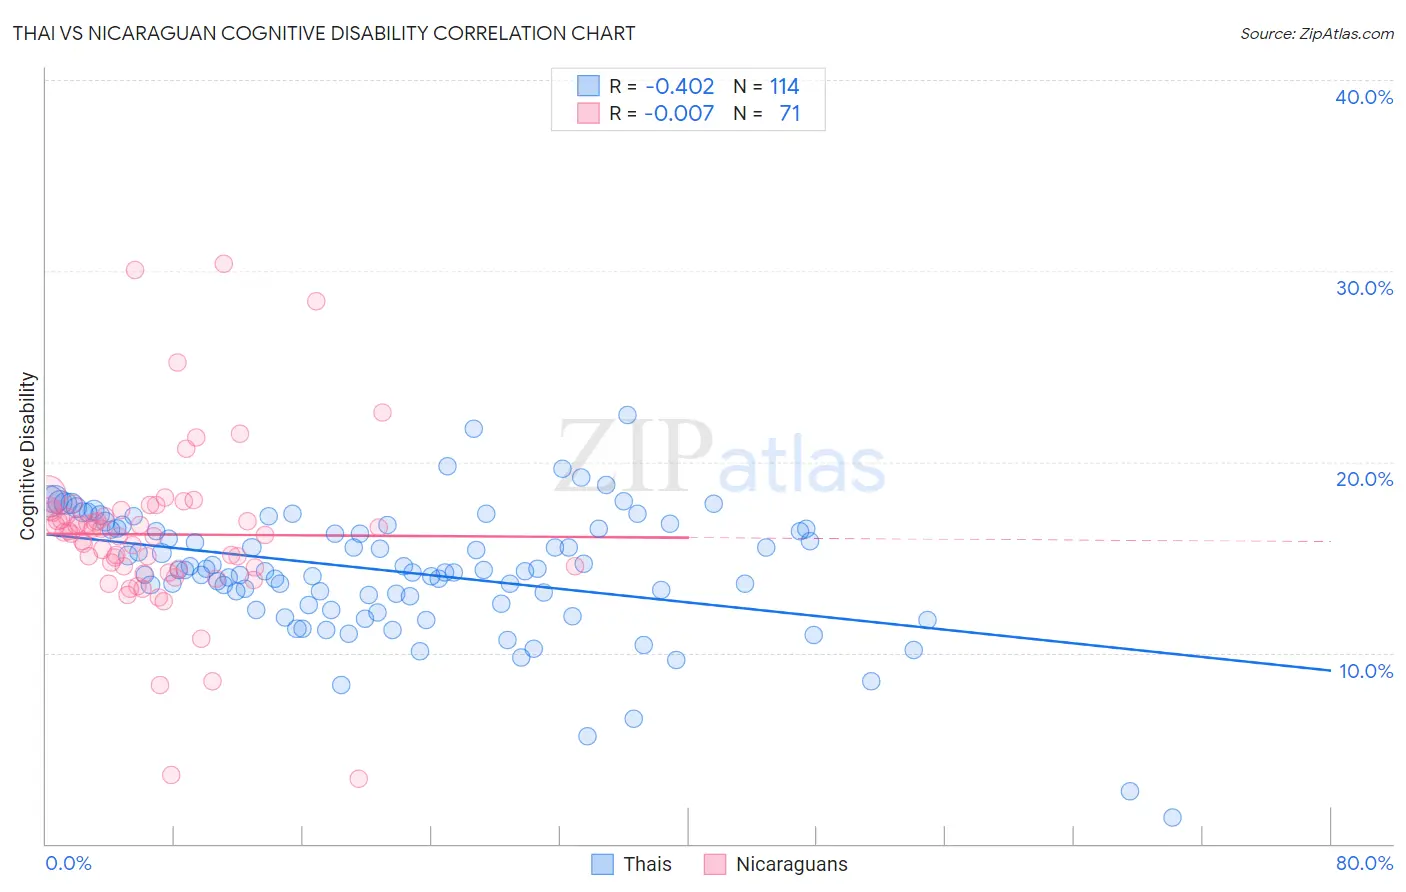
Thai vs Nicaraguan Cognitive Disability Correlation Chart
The statistical analysis conducted on geographies consisting of 475,822,165 people shows a moderate negative correlation between the proportion of Thais and percentage of population with cognitive disability in the United States with a correlation coefficient (R) of -0.402 and weighted average of 16.1%. Similarly, the statistical analysis conducted on geographies consisting of 285,693,430 people shows no correlation between the proportion of Nicaraguans and percentage of population with cognitive disability in the United States with a correlation coefficient (R) of -0.007 and weighted average of 17.0%, a difference of 5.2%.
Cognitive Disability Correlation Summary
| Measurement | Thai | Nicaraguan |
| Minimum | 1.4% | 3.4% |
| Maximum | 22.4% | 30.4% |
| Range | 21.1% | 26.9% |
| Mean | 14.3% | 16.2% |
| Median | 14.3% | 16.2% |
| Interquartile 25% (IQ1) | 12.6% | 14.4% |
| Interquartile 75% (IQ3) | 16.5% | 17.4% |
| Interquartile Range (IQR) | 3.9% | 3.0% |
| Standard Deviation (Sample) | 3.3% | 4.4% |
| Standard Deviation (Population) | 3.3% | 4.4% |
Similar Demographics by Cognitive Disability
Demographics Similar to Thais by Cognitive Disability
In terms of cognitive disability, the demographic groups most similar to Thais are Immigrants from Ireland (16.1%, a difference of 0.11%), Immigrants from Poland (16.1%, a difference of 0.13%), Assyrian/Chaldean/Syriac (16.2%, a difference of 0.45%), Immigrants from Scotland (16.2%, a difference of 0.50%), and Immigrants from Czechoslovakia (16.2%, a difference of 0.58%).
| Demographics | Rating | Rank | Cognitive Disability |
| Immigrants | Taiwan | 100.0 /100 | #1 | Exceptional 15.7% |
| Immigrants | India | 100.0 /100 | #2 | Exceptional 15.9% |
| Chinese | 100.0 /100 | #3 | Exceptional 15.9% |
| Immigrants | Lithuania | 100.0 /100 | #4 | Exceptional 16.0% |
| Immigrants | Hong Kong | 100.0 /100 | #5 | Exceptional 16.0% |
| Thais | 100.0 /100 | #6 | Exceptional 16.1% |
| Immigrants | Ireland | 100.0 /100 | #7 | Exceptional 16.1% |
| Immigrants | Poland | 100.0 /100 | #8 | Exceptional 16.1% |
| Assyrians/Chaldeans/Syriacs | 100.0 /100 | #9 | Exceptional 16.2% |
| Immigrants | Scotland | 100.0 /100 | #10 | Exceptional 16.2% |
| Immigrants | Czechoslovakia | 100.0 /100 | #11 | Exceptional 16.2% |
| Maltese | 100.0 /100 | #12 | Exceptional 16.2% |
| Lithuanians | 100.0 /100 | #13 | Exceptional 16.3% |
| Immigrants | Austria | 100.0 /100 | #14 | Exceptional 16.3% |
| Immigrants | Greece | 100.0 /100 | #15 | Exceptional 16.3% |
Demographics Similar to Nicaraguans by Cognitive Disability
In terms of cognitive disability, the demographic groups most similar to Nicaraguans are Immigrants from Costa Rica (17.0%, a difference of 0.010%), Immigrants from Uruguay (17.0%, a difference of 0.010%), European (17.0%, a difference of 0.050%), Immigrants from Vietnam (17.0%, a difference of 0.070%), and Immigrants from Germany (17.0%, a difference of 0.090%).
| Demographics | Rating | Rank | Cognitive Disability |
| Immigrants | China | 94.9 /100 | #121 | Exceptional 16.9% |
| Immigrants | Western Europe | 94.8 /100 | #122 | Exceptional 16.9% |
| Portuguese | 94.7 /100 | #123 | Exceptional 16.9% |
| Turks | 94.5 /100 | #124 | Exceptional 16.9% |
| Scandinavians | 94.1 /100 | #125 | Exceptional 16.9% |
| Europeans | 93.4 /100 | #126 | Exceptional 17.0% |
| Immigrants | Costa Rica | 93.1 /100 | #127 | Exceptional 17.0% |
| Nicaraguans | 93.0 /100 | #128 | Exceptional 17.0% |
| Immigrants | Uruguay | 92.9 /100 | #129 | Exceptional 17.0% |
| Immigrants | Vietnam | 92.4 /100 | #130 | Exceptional 17.0% |
| Immigrants | Germany | 92.1 /100 | #131 | Exceptional 17.0% |
| Whites/Caucasians | 92.1 /100 | #132 | Exceptional 17.0% |
| Immigrants | Jordan | 91.9 /100 | #133 | Exceptional 17.0% |
| Immigrants | Chile | 91.7 /100 | #134 | Exceptional 17.0% |
| Lebanese | 91.3 /100 | #135 | Exceptional 17.0% |