Guamanian/Chamorro vs Immigrants from Bangladesh Cognitive Disability
COMPARE
Guamanian/Chamorro
Immigrants from Bangladesh
Cognitive Disability
Cognitive Disability Comparison
Guamanians/Chamorros
Immigrants from Bangladesh
17.9%
COGNITIVE DISABILITY
0.5/ 100
METRIC RATING
261st/ 347
METRIC RANK
17.8%
COGNITIVE DISABILITY
1.0/ 100
METRIC RATING
243rd/ 347
METRIC RANK
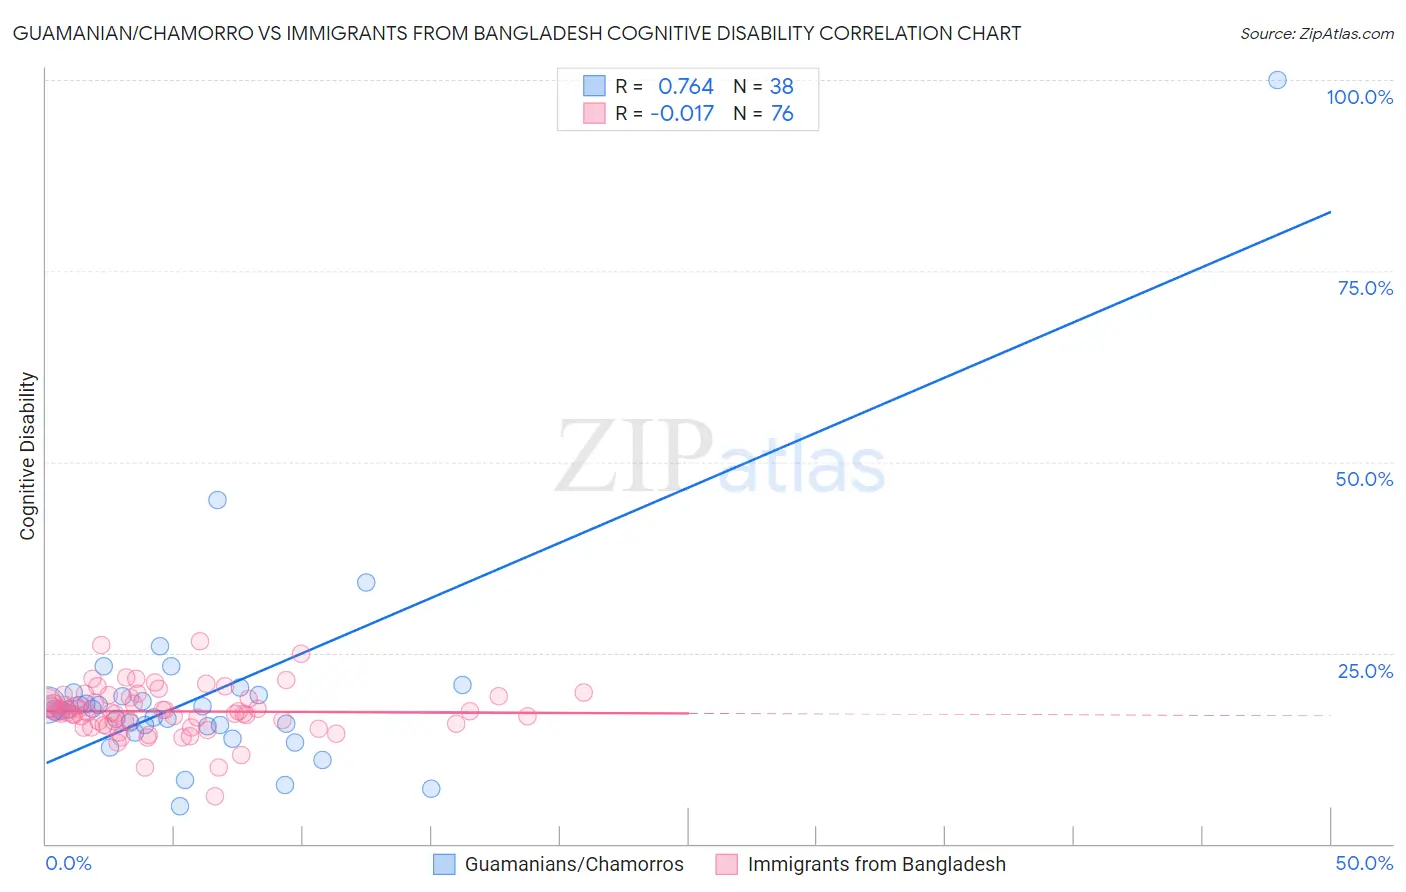
Guamanian/Chamorro vs Immigrants from Bangladesh Cognitive Disability Correlation Chart
The statistical analysis conducted on geographies consisting of 221,888,944 people shows a strong positive correlation between the proportion of Guamanians/Chamorros and percentage of population with cognitive disability in the United States with a correlation coefficient (R) of 0.764 and weighted average of 17.9%. Similarly, the statistical analysis conducted on geographies consisting of 203,670,223 people shows no correlation between the proportion of Immigrants from Bangladesh and percentage of population with cognitive disability in the United States with a correlation coefficient (R) of -0.017 and weighted average of 17.8%, a difference of 0.52%.
Cognitive Disability Correlation Summary
| Measurement | Guamanian/Chamorro | Immigrants from Bangladesh |
| Minimum | 5.0% | 6.2% |
| Maximum | 100.0% | 26.5% |
| Range | 95.0% | 20.3% |
| Mean | 19.8% | 17.3% |
| Median | 17.5% | 17.2% |
| Interquartile 25% (IQ1) | 15.4% | 15.6% |
| Interquartile 75% (IQ3) | 19.5% | 19.1% |
| Interquartile Range (IQR) | 4.0% | 3.4% |
| Standard Deviation (Sample) | 15.1% | 3.2% |
| Standard Deviation (Population) | 14.9% | 3.2% |
Demographics Similar to Guamanians/Chamorros and Immigrants from Bangladesh by Cognitive Disability
In terms of cognitive disability, the demographic groups most similar to Guamanians/Chamorros are Sierra Leonean (17.9%, a difference of 0.030%), Immigrants from Belize (17.9%, a difference of 0.050%), Ethiopian (17.9%, a difference of 0.060%), Immigrants from Armenia (17.9%, a difference of 0.14%), and Mexican American Indian (17.9%, a difference of 0.15%). Similarly, the demographic groups most similar to Immigrants from Bangladesh are Jamaican (17.9%, a difference of 0.040%), Paiute (17.8%, a difference of 0.070%), Trinidadian and Tobagonian (17.9%, a difference of 0.13%), Immigrants from Thailand (17.9%, a difference of 0.15%), and Samoan (17.9%, a difference of 0.23%).
| Demographics | Rating | Rank | Cognitive Disability |
| Paiute | 1.1 /100 | #242 | Tragic 17.8% |
| Immigrants | Bangladesh | 1.0 /100 | #243 | Tragic 17.8% |
| Jamaicans | 0.9 /100 | #244 | Tragic 17.9% |
| Trinidadians and Tobagonians | 0.8 /100 | #245 | Tragic 17.9% |
| Immigrants | Thailand | 0.8 /100 | #246 | Tragic 17.9% |
| Samoans | 0.7 /100 | #247 | Tragic 17.9% |
| French American Indians | 0.7 /100 | #248 | Tragic 17.9% |
| Cree | 0.7 /100 | #249 | Tragic 17.9% |
| Immigrants | Ethiopia | 0.7 /100 | #250 | Tragic 17.9% |
| Malaysians | 0.6 /100 | #251 | Tragic 17.9% |
| Immigrants | Grenada | 0.6 /100 | #252 | Tragic 17.9% |
| Hopi | 0.6 /100 | #253 | Tragic 17.9% |
| Hispanics or Latinos | 0.6 /100 | #254 | Tragic 17.9% |
| Immigrants | Azores | 0.6 /100 | #255 | Tragic 17.9% |
| Bahamians | 0.6 /100 | #256 | Tragic 17.9% |
| Mexican American Indians | 0.6 /100 | #257 | Tragic 17.9% |
| Immigrants | Armenia | 0.6 /100 | #258 | Tragic 17.9% |
| Ethiopians | 0.5 /100 | #259 | Tragic 17.9% |
| Immigrants | Belize | 0.5 /100 | #260 | Tragic 17.9% |
| Guamanians/Chamorros | 0.5 /100 | #261 | Tragic 17.9% |
| Sierra Leoneans | 0.4 /100 | #262 | Tragic 17.9% |