Irish vs Nicaraguan Cognitive Disability
COMPARE
Irish
Nicaraguan
Cognitive Disability
Cognitive Disability Comparison
Irish
Nicaraguans
16.8%
COGNITIVE DISABILITY
98.1/ 100
METRIC RATING
102nd/ 347
METRIC RANK
17.0%
COGNITIVE DISABILITY
93.0/ 100
METRIC RATING
128th/ 347
METRIC RANK
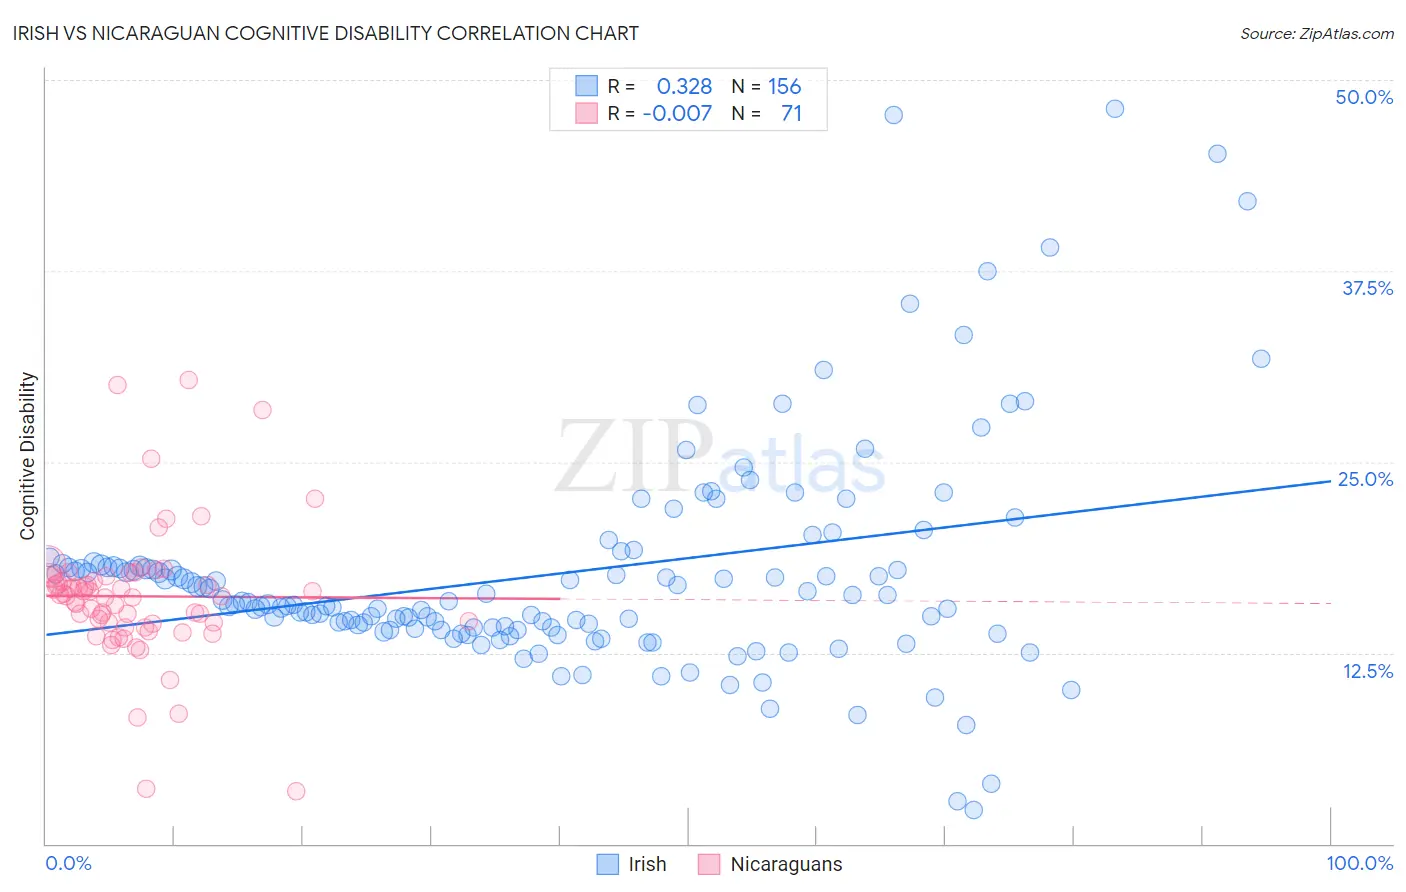
Irish vs Nicaraguan Cognitive Disability Correlation Chart
The statistical analysis conducted on geographies consisting of 580,428,608 people shows a mild positive correlation between the proportion of Irish and percentage of population with cognitive disability in the United States with a correlation coefficient (R) of 0.328 and weighted average of 16.8%. Similarly, the statistical analysis conducted on geographies consisting of 285,693,430 people shows no correlation between the proportion of Nicaraguans and percentage of population with cognitive disability in the United States with a correlation coefficient (R) of -0.007 and weighted average of 17.0%, a difference of 0.99%.
Cognitive Disability Correlation Summary
| Measurement | Irish | Nicaraguan |
| Minimum | 2.2% | 3.4% |
| Maximum | 48.1% | 30.4% |
| Range | 45.9% | 26.9% |
| Mean | 17.7% | 16.2% |
| Median | 15.8% | 16.2% |
| Interquartile 25% (IQ1) | 14.1% | 14.4% |
| Interquartile 75% (IQ3) | 18.1% | 17.4% |
| Interquartile Range (IQR) | 4.0% | 3.0% |
| Standard Deviation (Sample) | 7.3% | 4.4% |
| Standard Deviation (Population) | 7.2% | 4.4% |
Similar Demographics by Cognitive Disability
Demographics Similar to Irish by Cognitive Disability
In terms of cognitive disability, the demographic groups most similar to Irish are Immigrants from Russia (16.8%, a difference of 0.030%), Immigrants from Asia (16.8%, a difference of 0.030%), Paraguayan (16.8%, a difference of 0.050%), Palestinian (16.8%, a difference of 0.050%), and Jordanian (16.8%, a difference of 0.060%).
| Demographics | Rating | Rank | Cognitive Disability |
| English | 98.6 /100 | #95 | Exceptional 16.8% |
| Finns | 98.5 /100 | #96 | Exceptional 16.8% |
| Dutch | 98.5 /100 | #97 | Exceptional 16.8% |
| Immigrants | Lebanon | 98.4 /100 | #98 | Exceptional 16.8% |
| Jordanians | 98.2 /100 | #99 | Exceptional 16.8% |
| Immigrants | Russia | 98.2 /100 | #100 | Exceptional 16.8% |
| Immigrants | Asia | 98.1 /100 | #101 | Exceptional 16.8% |
| Irish | 98.1 /100 | #102 | Exceptional 16.8% |
| Paraguayans | 98.0 /100 | #103 | Exceptional 16.8% |
| Palestinians | 98.0 /100 | #104 | Exceptional 16.8% |
| Immigrants | Eastern Asia | 97.9 /100 | #105 | Exceptional 16.8% |
| Northern Europeans | 97.8 /100 | #106 | Exceptional 16.8% |
| Immigrants | Nicaragua | 97.8 /100 | #107 | Exceptional 16.8% |
| Canadians | 97.5 /100 | #108 | Exceptional 16.8% |
| Albanians | 97.3 /100 | #109 | Exceptional 16.8% |
Demographics Similar to Nicaraguans by Cognitive Disability
In terms of cognitive disability, the demographic groups most similar to Nicaraguans are Immigrants from Costa Rica (17.0%, a difference of 0.010%), Immigrants from Uruguay (17.0%, a difference of 0.010%), European (17.0%, a difference of 0.050%), Immigrants from Vietnam (17.0%, a difference of 0.070%), and Immigrants from Germany (17.0%, a difference of 0.090%).
| Demographics | Rating | Rank | Cognitive Disability |
| Immigrants | China | 94.9 /100 | #121 | Exceptional 16.9% |
| Immigrants | Western Europe | 94.8 /100 | #122 | Exceptional 16.9% |
| Portuguese | 94.7 /100 | #123 | Exceptional 16.9% |
| Turks | 94.5 /100 | #124 | Exceptional 16.9% |
| Scandinavians | 94.1 /100 | #125 | Exceptional 16.9% |
| Europeans | 93.4 /100 | #126 | Exceptional 17.0% |
| Immigrants | Costa Rica | 93.1 /100 | #127 | Exceptional 17.0% |
| Nicaraguans | 93.0 /100 | #128 | Exceptional 17.0% |
| Immigrants | Uruguay | 92.9 /100 | #129 | Exceptional 17.0% |
| Immigrants | Vietnam | 92.4 /100 | #130 | Exceptional 17.0% |
| Immigrants | Germany | 92.1 /100 | #131 | Exceptional 17.0% |
| Whites/Caucasians | 92.1 /100 | #132 | Exceptional 17.0% |
| Immigrants | Jordan | 91.9 /100 | #133 | Exceptional 17.0% |
| Immigrants | Chile | 91.7 /100 | #134 | Exceptional 17.0% |
| Lebanese | 91.3 /100 | #135 | Exceptional 17.0% |