Mexican vs Nicaraguan Cognitive Disability
COMPARE
Mexican
Nicaraguan
Cognitive Disability
Cognitive Disability Comparison
Mexicans
Nicaraguans
17.8%
COGNITIVE DISABILITY
1.1/ 100
METRIC RATING
241st/ 347
METRIC RANK
17.0%
COGNITIVE DISABILITY
93.0/ 100
METRIC RATING
128th/ 347
METRIC RANK
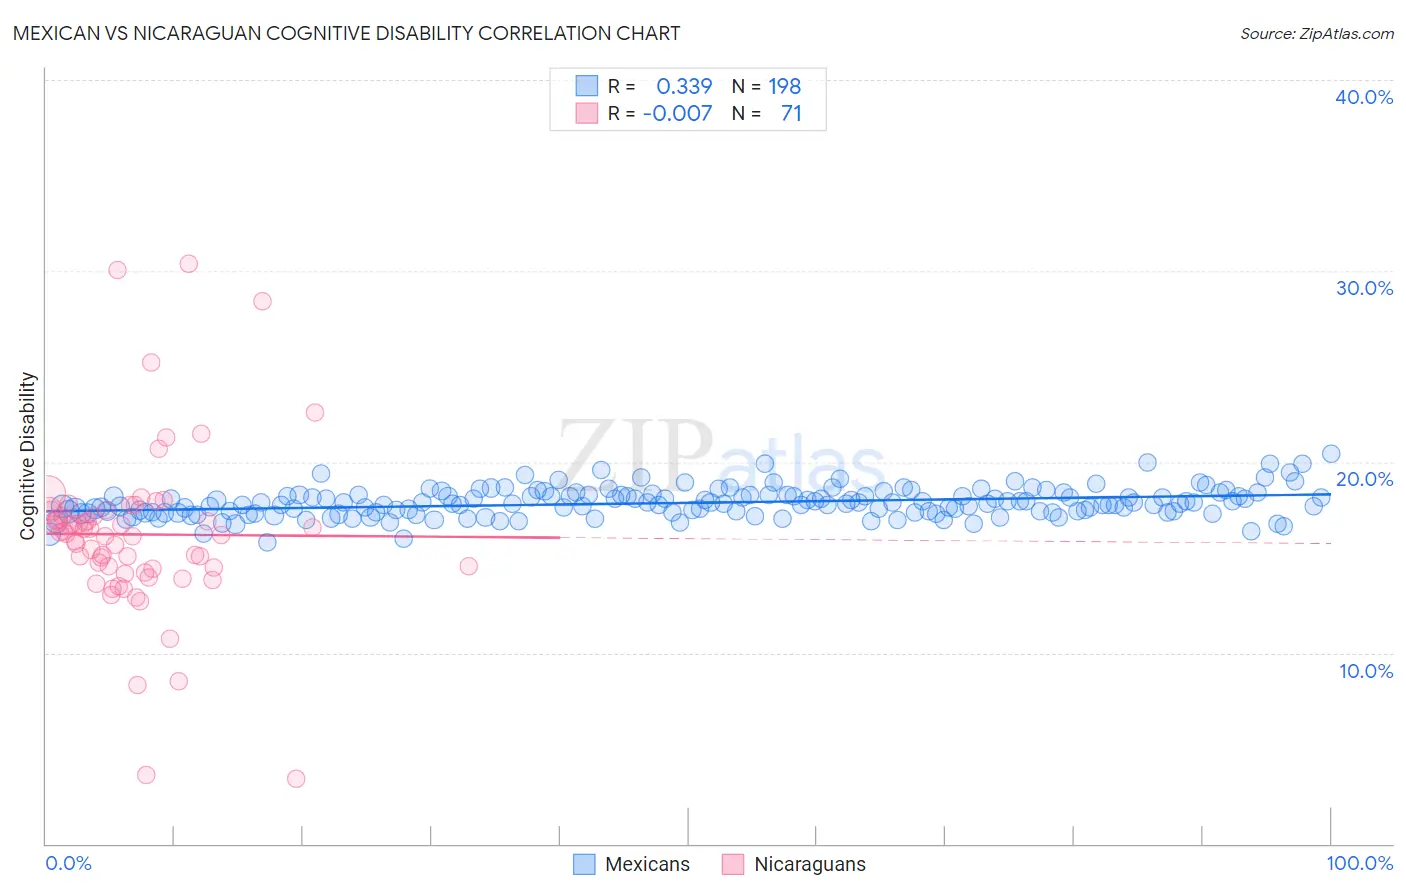
Mexican vs Nicaraguan Cognitive Disability Correlation Chart
The statistical analysis conducted on geographies consisting of 565,048,688 people shows a mild positive correlation between the proportion of Mexicans and percentage of population with cognitive disability in the United States with a correlation coefficient (R) of 0.339 and weighted average of 17.8%. Similarly, the statistical analysis conducted on geographies consisting of 285,693,430 people shows no correlation between the proportion of Nicaraguans and percentage of population with cognitive disability in the United States with a correlation coefficient (R) of -0.007 and weighted average of 17.0%, a difference of 5.1%.
Cognitive Disability Correlation Summary
| Measurement | Mexican | Nicaraguan |
| Minimum | 15.8% | 3.4% |
| Maximum | 20.4% | 30.4% |
| Range | 4.6% | 26.9% |
| Mean | 17.9% | 16.2% |
| Median | 17.8% | 16.2% |
| Interquartile 25% (IQ1) | 17.3% | 14.4% |
| Interquartile 75% (IQ3) | 18.2% | 17.4% |
| Interquartile Range (IQR) | 0.90% | 3.0% |
| Standard Deviation (Sample) | 0.75% | 4.4% |
| Standard Deviation (Population) | 0.75% | 4.4% |
Similar Demographics by Cognitive Disability
Demographics Similar to Mexicans by Cognitive Disability
In terms of cognitive disability, the demographic groups most similar to Mexicans are Paiute (17.8%, a difference of 0.020%), Immigrants from Bangladesh (17.8%, a difference of 0.090%), Jamaican (17.9%, a difference of 0.13%), Iraqi (17.8%, a difference of 0.14%), and Cajun (17.8%, a difference of 0.18%).
| Demographics | Rating | Rank | Cognitive Disability |
| Osage | 2.0 /100 | #234 | Tragic 17.8% |
| Spanish American Indians | 2.0 /100 | #235 | Tragic 17.8% |
| Immigrants | Iraq | 1.8 /100 | #236 | Tragic 17.8% |
| Immigrants | Mexico | 1.8 /100 | #237 | Tragic 17.8% |
| Cheyenne | 1.7 /100 | #238 | Tragic 17.8% |
| Cajuns | 1.4 /100 | #239 | Tragic 17.8% |
| Iraqis | 1.4 /100 | #240 | Tragic 17.8% |
| Mexicans | 1.1 /100 | #241 | Tragic 17.8% |
| Paiute | 1.1 /100 | #242 | Tragic 17.8% |
| Immigrants | Bangladesh | 1.0 /100 | #243 | Tragic 17.8% |
| Jamaicans | 0.9 /100 | #244 | Tragic 17.9% |
| Trinidadians and Tobagonians | 0.8 /100 | #245 | Tragic 17.9% |
| Immigrants | Thailand | 0.8 /100 | #246 | Tragic 17.9% |
| Samoans | 0.7 /100 | #247 | Tragic 17.9% |
| French American Indians | 0.7 /100 | #248 | Tragic 17.9% |
Demographics Similar to Nicaraguans by Cognitive Disability
In terms of cognitive disability, the demographic groups most similar to Nicaraguans are Immigrants from Costa Rica (17.0%, a difference of 0.010%), Immigrants from Uruguay (17.0%, a difference of 0.010%), European (17.0%, a difference of 0.050%), Immigrants from Vietnam (17.0%, a difference of 0.070%), and Immigrants from Germany (17.0%, a difference of 0.090%).
| Demographics | Rating | Rank | Cognitive Disability |
| Immigrants | China | 94.9 /100 | #121 | Exceptional 16.9% |
| Immigrants | Western Europe | 94.8 /100 | #122 | Exceptional 16.9% |
| Portuguese | 94.7 /100 | #123 | Exceptional 16.9% |
| Turks | 94.5 /100 | #124 | Exceptional 16.9% |
| Scandinavians | 94.1 /100 | #125 | Exceptional 16.9% |
| Europeans | 93.4 /100 | #126 | Exceptional 17.0% |
| Immigrants | Costa Rica | 93.1 /100 | #127 | Exceptional 17.0% |
| Nicaraguans | 93.0 /100 | #128 | Exceptional 17.0% |
| Immigrants | Uruguay | 92.9 /100 | #129 | Exceptional 17.0% |
| Immigrants | Vietnam | 92.4 /100 | #130 | Exceptional 17.0% |
| Immigrants | Germany | 92.1 /100 | #131 | Exceptional 17.0% |
| Whites/Caucasians | 92.1 /100 | #132 | Exceptional 17.0% |
| Immigrants | Jordan | 91.9 /100 | #133 | Exceptional 17.0% |
| Immigrants | Chile | 91.7 /100 | #134 | Exceptional 17.0% |
| Lebanese | 91.3 /100 | #135 | Exceptional 17.0% |