Guamanian/Chamorro vs Nicaraguan Child Poverty Among Boys Under 16
COMPARE
Guamanian/Chamorro
Nicaraguan
Child Poverty Among Boys Under 16
Child Poverty Among Boys Under 16 Comparison
Guamanians/Chamorros
Nicaraguans
16.1%
CHILD POVERTY AMONG BOYS UNDER 16
69.6/ 100
METRIC RATING
162nd/ 347
METRIC RANK
18.4%
CHILD POVERTY AMONG BOYS UNDER 16
1.4/ 100
METRIC RATING
231st/ 347
METRIC RANK
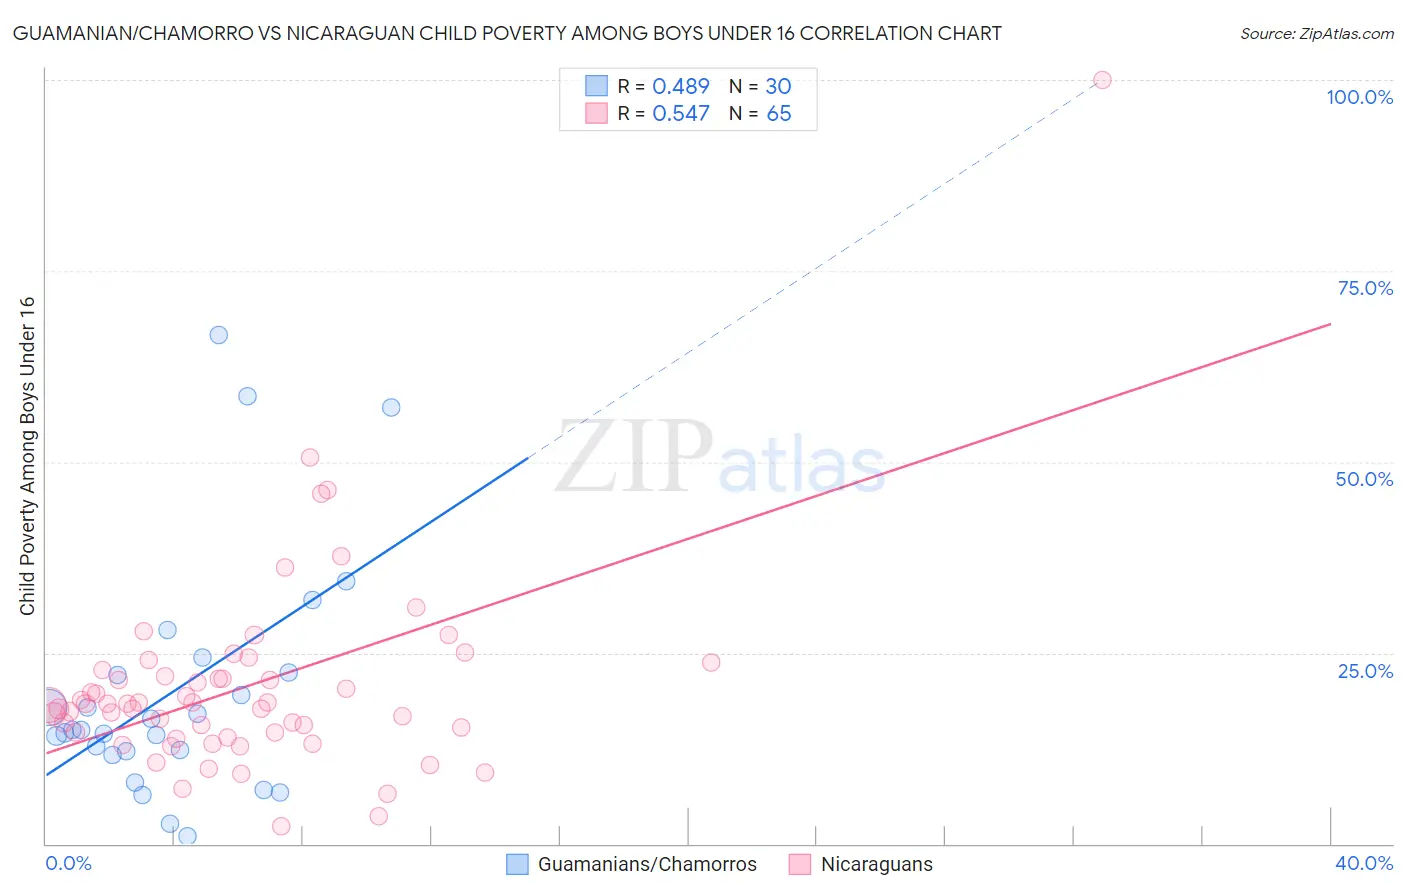
Guamanian/Chamorro vs Nicaraguan Child Poverty Among Boys Under 16 Correlation Chart
The statistical analysis conducted on geographies consisting of 220,488,068 people shows a moderate positive correlation between the proportion of Guamanians/Chamorros and poverty level among boys under the age of 16 in the United States with a correlation coefficient (R) of 0.489 and weighted average of 16.1%. Similarly, the statistical analysis conducted on geographies consisting of 283,666,895 people shows a substantial positive correlation between the proportion of Nicaraguans and poverty level among boys under the age of 16 in the United States with a correlation coefficient (R) of 0.547 and weighted average of 18.4%, a difference of 14.4%.
Child Poverty Among Boys Under 16 Correlation Summary
| Measurement | Guamanian/Chamorro | Nicaraguan |
| Minimum | 1.0% | 2.3% |
| Maximum | 66.7% | 100.0% |
| Range | 65.6% | 97.7% |
| Mean | 20.1% | 20.6% |
| Median | 14.9% | 18.3% |
| Interquartile 25% (IQ1) | 12.0% | 14.3% |
| Interquartile 75% (IQ3) | 22.4% | 22.4% |
| Interquartile Range (IQR) | 10.3% | 8.1% |
| Standard Deviation (Sample) | 15.8% | 13.5% |
| Standard Deviation (Population) | 15.6% | 13.4% |
Similar Demographics by Child Poverty Among Boys Under 16
Demographics Similar to Guamanians/Chamorros by Child Poverty Among Boys Under 16
In terms of child poverty among boys under 16, the demographic groups most similar to Guamanians/Chamorros are Costa Rican (16.1%, a difference of 0.20%), Immigrants from Albania (16.1%, a difference of 0.22%), Immigrants from Oceania (16.0%, a difference of 0.23%), Immigrants from Northern Africa (16.0%, a difference of 0.24%), and Colombian (16.1%, a difference of 0.58%).
| Demographics | Rating | Rank | Child Poverty Among Boys Under 16 |
| French Canadians | 76.6 /100 | #155 | Good 15.9% |
| Israelis | 76.5 /100 | #156 | Good 15.9% |
| Immigrants | Nepal | 76.0 /100 | #157 | Good 15.9% |
| Yugoslavians | 75.9 /100 | #158 | Good 15.9% |
| Immigrants | Chile | 74.8 /100 | #159 | Good 15.9% |
| Immigrants | Northern Africa | 71.3 /100 | #160 | Good 16.0% |
| Immigrants | Oceania | 71.3 /100 | #161 | Good 16.0% |
| Guamanians/Chamorros | 69.6 /100 | #162 | Good 16.1% |
| Costa Ricans | 68.1 /100 | #163 | Good 16.1% |
| Immigrants | Albania | 67.9 /100 | #164 | Good 16.1% |
| Colombians | 65.2 /100 | #165 | Good 16.1% |
| Immigrants | Germany | 63.6 /100 | #166 | Good 16.2% |
| Afghans | 55.4 /100 | #167 | Average 16.3% |
| South Americans | 55.3 /100 | #168 | Average 16.3% |
| Immigrants | Saudi Arabia | 53.6 /100 | #169 | Average 16.4% |
Demographics Similar to Nicaraguans by Child Poverty Among Boys Under 16
In terms of child poverty among boys under 16, the demographic groups most similar to Nicaraguans are Marshallese (18.4%, a difference of 0.20%), Immigrants from Nigeria (18.4%, a difference of 0.39%), Immigrants from Micronesia (18.3%, a difference of 0.53%), Fijian (18.3%, a difference of 0.53%), and Nigerian (18.5%, a difference of 0.64%).
| Demographics | Rating | Rank | Child Poverty Among Boys Under 16 |
| Nepalese | 3.2 /100 | #224 | Tragic 18.0% |
| Inupiat | 2.7 /100 | #225 | Tragic 18.1% |
| Immigrants | Africa | 2.6 /100 | #226 | Tragic 18.1% |
| Bermudans | 2.5 /100 | #227 | Tragic 18.1% |
| Immigrants | Nonimmigrants | 2.2 /100 | #228 | Tragic 18.2% |
| Immigrants | Micronesia | 1.8 /100 | #229 | Tragic 18.3% |
| Fijians | 1.8 /100 | #230 | Tragic 18.3% |
| Nicaraguans | 1.4 /100 | #231 | Tragic 18.4% |
| Marshallese | 1.3 /100 | #232 | Tragic 18.4% |
| Immigrants | Nigeria | 1.2 /100 | #233 | Tragic 18.4% |
| Nigerians | 1.1 /100 | #234 | Tragic 18.5% |
| Americans | 0.9 /100 | #235 | Tragic 18.6% |
| Sudanese | 0.9 /100 | #236 | Tragic 18.6% |
| Immigrants | Eritrea | 0.8 /100 | #237 | Tragic 18.6% |
| Immigrants | Laos | 0.8 /100 | #238 | Tragic 18.7% |