Ghanaian vs Nicaraguan Cognitive Disability
COMPARE
Ghanaian
Nicaraguan
Cognitive Disability
Cognitive Disability Comparison
Ghanaians
Nicaraguans
18.3%
COGNITIVE DISABILITY
0.0/ 100
METRIC RATING
299th/ 347
METRIC RANK
17.0%
COGNITIVE DISABILITY
93.0/ 100
METRIC RATING
128th/ 347
METRIC RANK
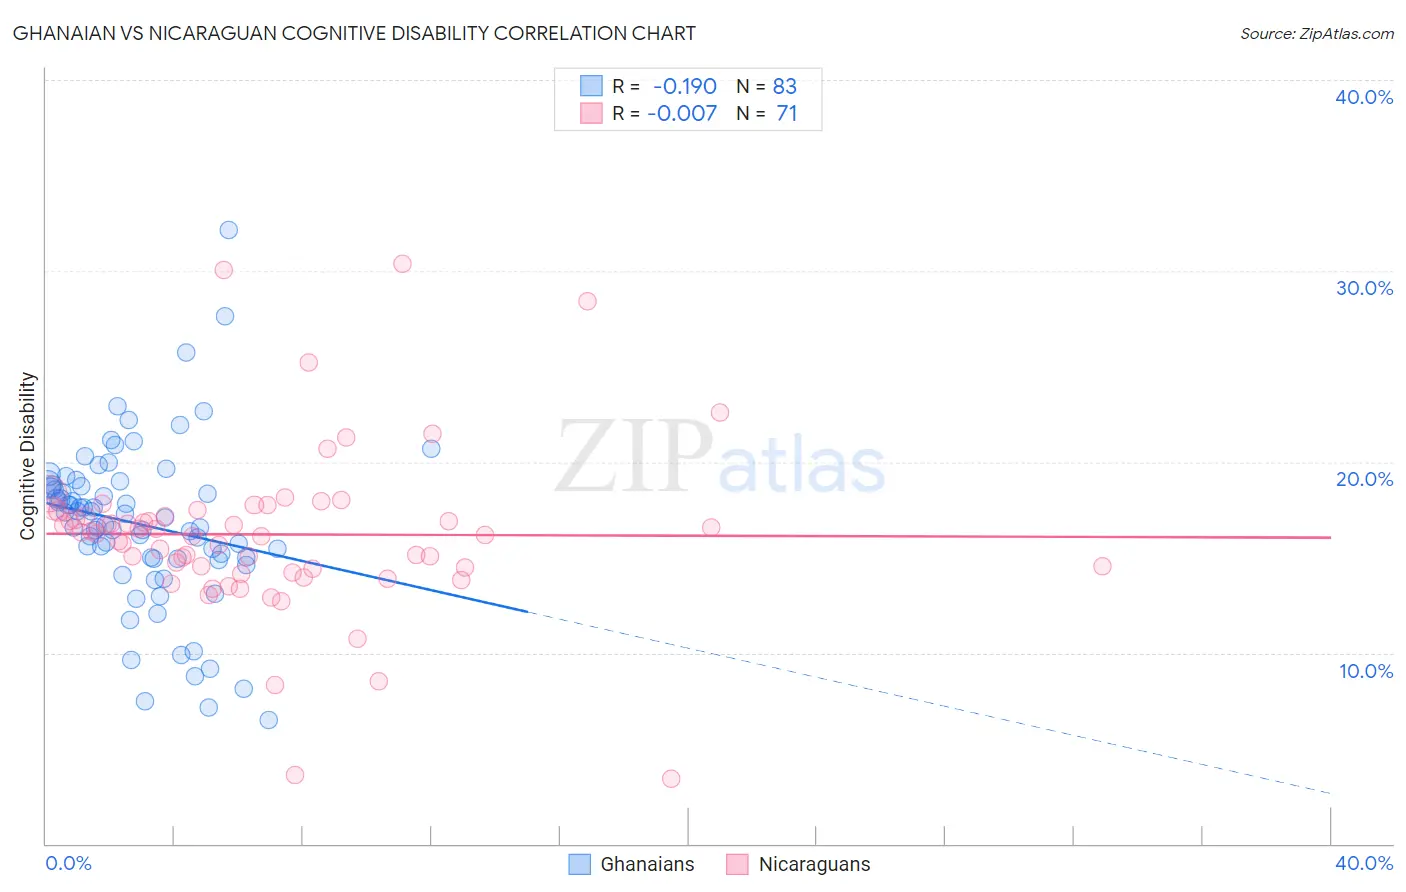
Ghanaian vs Nicaraguan Cognitive Disability Correlation Chart
The statistical analysis conducted on geographies consisting of 190,691,747 people shows a poor negative correlation between the proportion of Ghanaians and percentage of population with cognitive disability in the United States with a correlation coefficient (R) of -0.190 and weighted average of 18.3%. Similarly, the statistical analysis conducted on geographies consisting of 285,693,430 people shows no correlation between the proportion of Nicaraguans and percentage of population with cognitive disability in the United States with a correlation coefficient (R) of -0.007 and weighted average of 17.0%, a difference of 7.7%.
Cognitive Disability Correlation Summary
| Measurement | Ghanaian | Nicaraguan |
| Minimum | 6.5% | 3.4% |
| Maximum | 32.2% | 30.4% |
| Range | 25.7% | 26.9% |
| Mean | 16.7% | 16.2% |
| Median | 17.1% | 16.2% |
| Interquartile 25% (IQ1) | 15.0% | 14.4% |
| Interquartile 75% (IQ3) | 18.8% | 17.4% |
| Interquartile Range (IQR) | 3.8% | 3.0% |
| Standard Deviation (Sample) | 4.3% | 4.4% |
| Standard Deviation (Population) | 4.3% | 4.4% |
Similar Demographics by Cognitive Disability
Demographics Similar to Ghanaians by Cognitive Disability
In terms of cognitive disability, the demographic groups most similar to Ghanaians are Creek (18.3%, a difference of 0.020%), Japanese (18.3%, a difference of 0.030%), Blackfeet (18.3%, a difference of 0.040%), Immigrants from Ghana (18.3%, a difference of 0.17%), and Immigrants from Burma/Myanmar (18.2%, a difference of 0.18%).
| Demographics | Rating | Rank | Cognitive Disability |
| Iroquois | 0.1 /100 | #292 | Tragic 18.2% |
| Central American Indians | 0.1 /100 | #293 | Tragic 18.2% |
| British West Indians | 0.1 /100 | #294 | Tragic 18.2% |
| German Russians | 0.0 /100 | #295 | Tragic 18.2% |
| Immigrants | Burma/Myanmar | 0.0 /100 | #296 | Tragic 18.2% |
| Blackfeet | 0.0 /100 | #297 | Tragic 18.3% |
| Japanese | 0.0 /100 | #298 | Tragic 18.3% |
| Ghanaians | 0.0 /100 | #299 | Tragic 18.3% |
| Creek | 0.0 /100 | #300 | Tragic 18.3% |
| Immigrants | Ghana | 0.0 /100 | #301 | Tragic 18.3% |
| Barbadians | 0.0 /100 | #302 | Tragic 18.3% |
| Immigrants | Kenya | 0.0 /100 | #303 | Tragic 18.3% |
| Immigrants | Eritrea | 0.0 /100 | #304 | Tragic 18.3% |
| Colville | 0.0 /100 | #305 | Tragic 18.3% |
| Seminole | 0.0 /100 | #306 | Tragic 18.3% |
Demographics Similar to Nicaraguans by Cognitive Disability
In terms of cognitive disability, the demographic groups most similar to Nicaraguans are Immigrants from Costa Rica (17.0%, a difference of 0.010%), Immigrants from Uruguay (17.0%, a difference of 0.010%), European (17.0%, a difference of 0.050%), Immigrants from Vietnam (17.0%, a difference of 0.070%), and Immigrants from Germany (17.0%, a difference of 0.090%).
| Demographics | Rating | Rank | Cognitive Disability |
| Immigrants | China | 94.9 /100 | #121 | Exceptional 16.9% |
| Immigrants | Western Europe | 94.8 /100 | #122 | Exceptional 16.9% |
| Portuguese | 94.7 /100 | #123 | Exceptional 16.9% |
| Turks | 94.5 /100 | #124 | Exceptional 16.9% |
| Scandinavians | 94.1 /100 | #125 | Exceptional 16.9% |
| Europeans | 93.4 /100 | #126 | Exceptional 17.0% |
| Immigrants | Costa Rica | 93.1 /100 | #127 | Exceptional 17.0% |
| Nicaraguans | 93.0 /100 | #128 | Exceptional 17.0% |
| Immigrants | Uruguay | 92.9 /100 | #129 | Exceptional 17.0% |
| Immigrants | Vietnam | 92.4 /100 | #130 | Exceptional 17.0% |
| Immigrants | Germany | 92.1 /100 | #131 | Exceptional 17.0% |
| Whites/Caucasians | 92.1 /100 | #132 | Exceptional 17.0% |
| Immigrants | Jordan | 91.9 /100 | #133 | Exceptional 17.0% |
| Immigrants | Chile | 91.7 /100 | #134 | Exceptional 17.0% |
| Lebanese | 91.3 /100 | #135 | Exceptional 17.0% |