Guamanian/Chamorro vs Immigrants from Grenada Cognitive Disability
COMPARE
Guamanian/Chamorro
Immigrants from Grenada
Cognitive Disability
Cognitive Disability Comparison
Guamanians/Chamorros
Immigrants from Grenada
17.9%
COGNITIVE DISABILITY
0.5/ 100
METRIC RATING
261st/ 347
METRIC RANK
17.9%
COGNITIVE DISABILITY
0.6/ 100
METRIC RATING
252nd/ 347
METRIC RANK
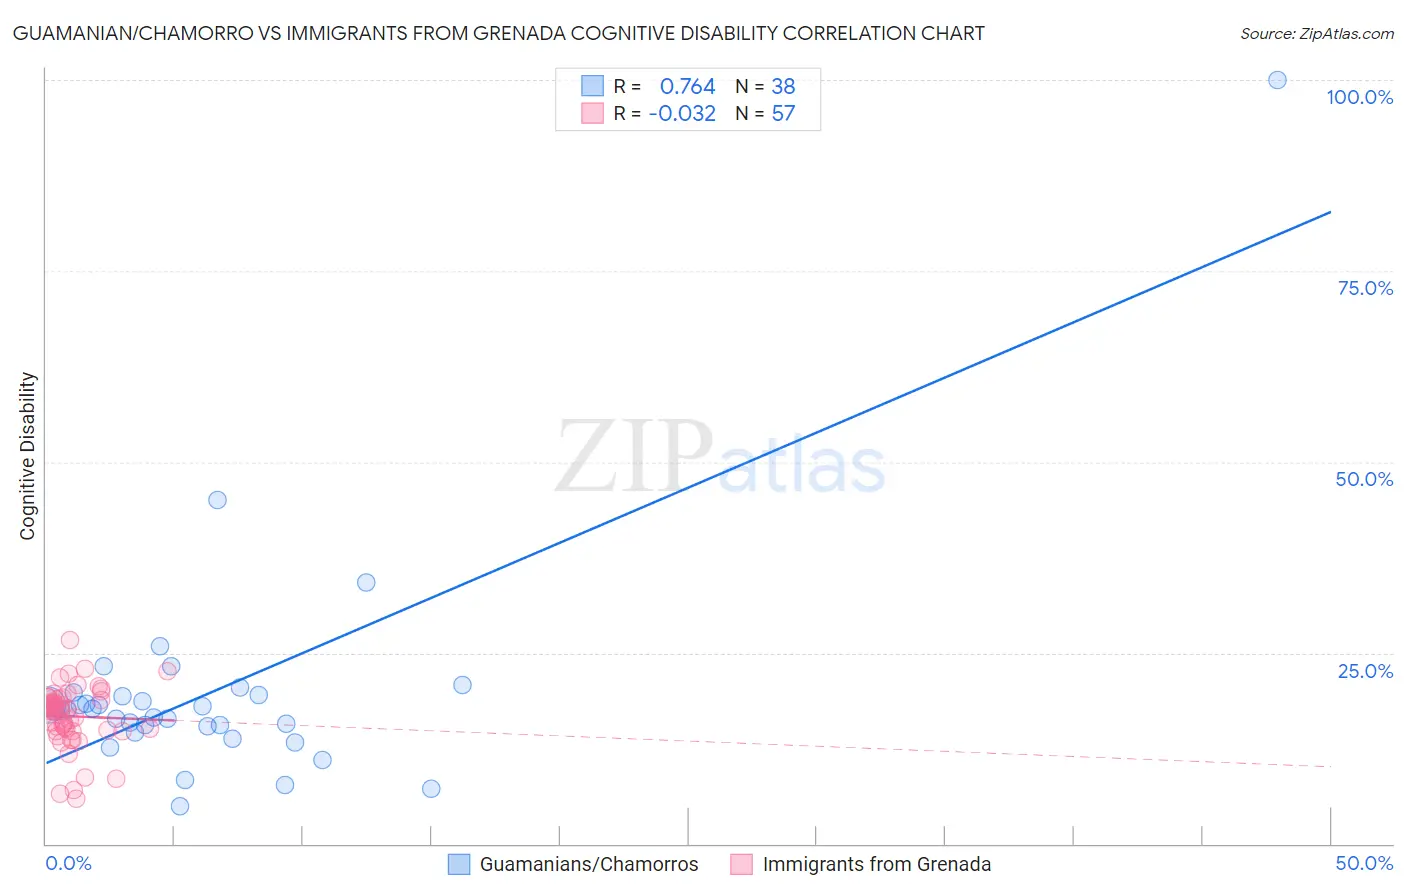
Guamanian/Chamorro vs Immigrants from Grenada Cognitive Disability Correlation Chart
The statistical analysis conducted on geographies consisting of 221,888,944 people shows a strong positive correlation between the proportion of Guamanians/Chamorros and percentage of population with cognitive disability in the United States with a correlation coefficient (R) of 0.764 and weighted average of 17.9%. Similarly, the statistical analysis conducted on geographies consisting of 67,189,782 people shows no correlation between the proportion of Immigrants from Grenada and percentage of population with cognitive disability in the United States with a correlation coefficient (R) of -0.032 and weighted average of 17.9%, a difference of 0.22%.
Cognitive Disability Correlation Summary
| Measurement | Guamanian/Chamorro | Immigrants from Grenada |
| Minimum | 5.0% | 5.9% |
| Maximum | 100.0% | 26.8% |
| Range | 95.0% | 20.9% |
| Mean | 19.8% | 16.7% |
| Median | 17.5% | 17.7% |
| Interquartile 25% (IQ1) | 15.4% | 14.8% |
| Interquartile 75% (IQ3) | 19.5% | 19.0% |
| Interquartile Range (IQR) | 4.0% | 4.2% |
| Standard Deviation (Sample) | 15.1% | 4.0% |
| Standard Deviation (Population) | 14.9% | 4.0% |
Demographics Similar to Guamanians/Chamorros and Immigrants from Grenada by Cognitive Disability
In terms of cognitive disability, the demographic groups most similar to Guamanians/Chamorros are Sierra Leonean (17.9%, a difference of 0.030%), Immigrants from Belize (17.9%, a difference of 0.050%), Ethiopian (17.9%, a difference of 0.060%), Immigrants from Barbados (17.9%, a difference of 0.070%), and Menominee (18.0%, a difference of 0.13%). Similarly, the demographic groups most similar to Immigrants from Grenada are Malaysian (17.9%, a difference of 0.010%), Hopi (17.9%, a difference of 0.010%), Cree (17.9%, a difference of 0.020%), Immigrants from Ethiopia (17.9%, a difference of 0.020%), and Hispanic or Latino (17.9%, a difference of 0.020%).
| Demographics | Rating | Rank | Cognitive Disability |
| Immigrants | Thailand | 0.8 /100 | #246 | Tragic 17.9% |
| Samoans | 0.7 /100 | #247 | Tragic 17.9% |
| French American Indians | 0.7 /100 | #248 | Tragic 17.9% |
| Cree | 0.7 /100 | #249 | Tragic 17.9% |
| Immigrants | Ethiopia | 0.7 /100 | #250 | Tragic 17.9% |
| Malaysians | 0.6 /100 | #251 | Tragic 17.9% |
| Immigrants | Grenada | 0.6 /100 | #252 | Tragic 17.9% |
| Hopi | 0.6 /100 | #253 | Tragic 17.9% |
| Hispanics or Latinos | 0.6 /100 | #254 | Tragic 17.9% |
| Immigrants | Azores | 0.6 /100 | #255 | Tragic 17.9% |
| Bahamians | 0.6 /100 | #256 | Tragic 17.9% |
| Mexican American Indians | 0.6 /100 | #257 | Tragic 17.9% |
| Immigrants | Armenia | 0.6 /100 | #258 | Tragic 17.9% |
| Ethiopians | 0.5 /100 | #259 | Tragic 17.9% |
| Immigrants | Belize | 0.5 /100 | #260 | Tragic 17.9% |
| Guamanians/Chamorros | 0.5 /100 | #261 | Tragic 17.9% |
| Sierra Leoneans | 0.4 /100 | #262 | Tragic 17.9% |
| Immigrants | Barbados | 0.4 /100 | #263 | Tragic 17.9% |
| Menominee | 0.4 /100 | #264 | Tragic 18.0% |
| Spanish Americans | 0.4 /100 | #265 | Tragic 18.0% |
| Belizeans | 0.4 /100 | #266 | Tragic 18.0% |