Guamanian/Chamorro vs Eastern European Cognitive Disability
COMPARE
Guamanian/Chamorro
Eastern European
Cognitive Disability
Cognitive Disability Comparison
Guamanians/Chamorros
Eastern Europeans
17.9%
COGNITIVE DISABILITY
0.5/ 100
METRIC RATING
261st/ 347
METRIC RANK
16.3%
COGNITIVE DISABILITY
100.0/ 100
METRIC RATING
16th/ 347
METRIC RANK
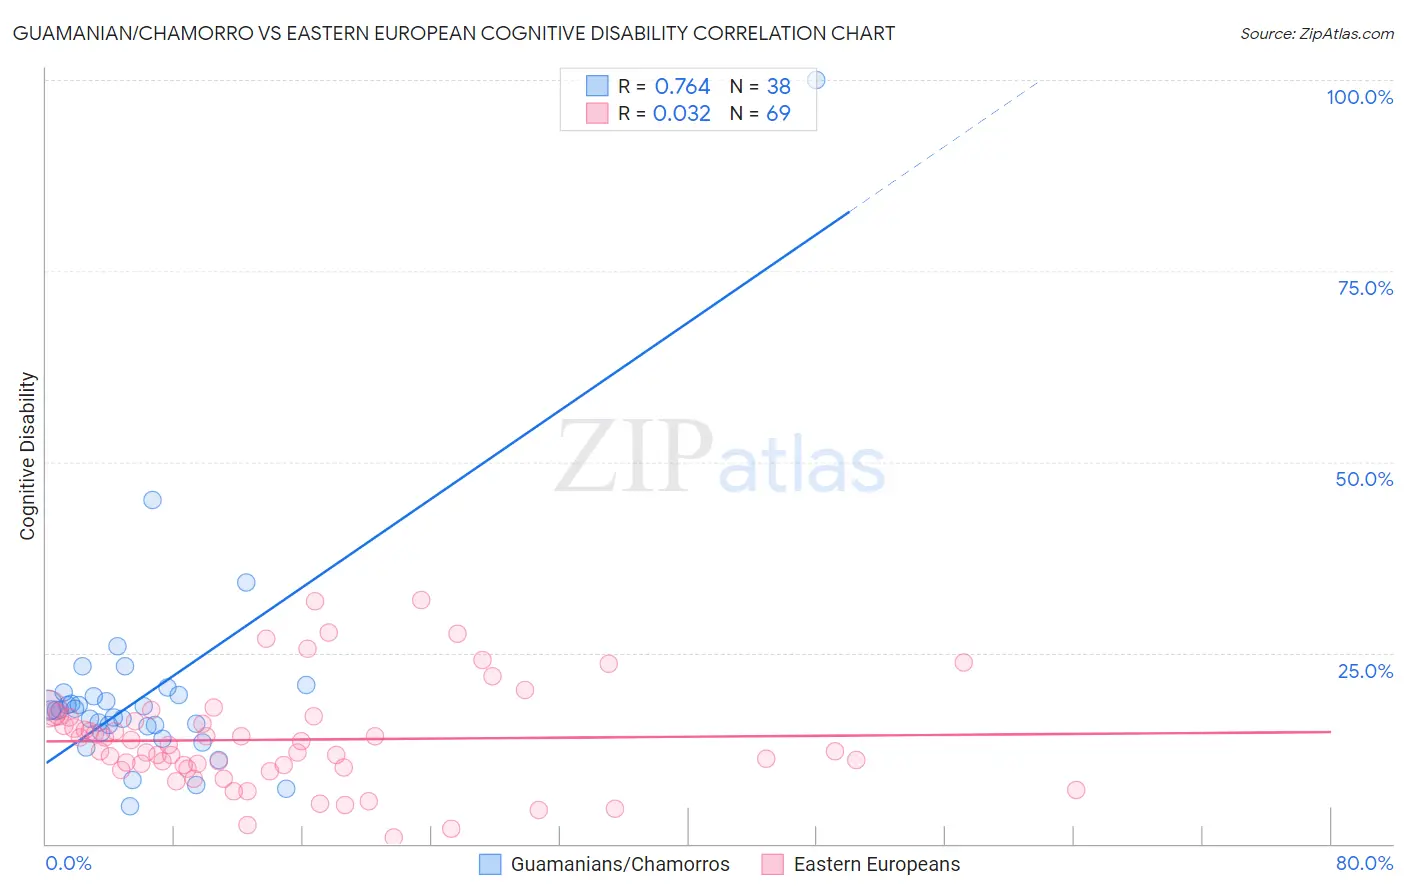
Guamanian/Chamorro vs Eastern European Cognitive Disability Correlation Chart
The statistical analysis conducted on geographies consisting of 221,888,944 people shows a strong positive correlation between the proportion of Guamanians/Chamorros and percentage of population with cognitive disability in the United States with a correlation coefficient (R) of 0.764 and weighted average of 17.9%. Similarly, the statistical analysis conducted on geographies consisting of 461,204,050 people shows no correlation between the proportion of Eastern Europeans and percentage of population with cognitive disability in the United States with a correlation coefficient (R) of 0.032 and weighted average of 16.3%, a difference of 9.9%.
Cognitive Disability Correlation Summary
| Measurement | Guamanian/Chamorro | Eastern European |
| Minimum | 5.0% | 0.87% |
| Maximum | 100.0% | 31.9% |
| Range | 95.0% | 31.0% |
| Mean | 19.8% | 13.6% |
| Median | 17.5% | 12.1% |
| Interquartile 25% (IQ1) | 15.4% | 9.9% |
| Interquartile 75% (IQ3) | 19.5% | 16.6% |
| Interquartile Range (IQR) | 4.0% | 6.7% |
| Standard Deviation (Sample) | 15.1% | 6.7% |
| Standard Deviation (Population) | 14.9% | 6.7% |
Similar Demographics by Cognitive Disability
Demographics Similar to Guamanians/Chamorros by Cognitive Disability
In terms of cognitive disability, the demographic groups most similar to Guamanians/Chamorros are Sierra Leonean (17.9%, a difference of 0.030%), Immigrants from Belize (17.9%, a difference of 0.050%), Ethiopian (17.9%, a difference of 0.060%), Immigrants from Barbados (17.9%, a difference of 0.070%), and Menominee (18.0%, a difference of 0.13%).
| Demographics | Rating | Rank | Cognitive Disability |
| Hispanics or Latinos | 0.6 /100 | #254 | Tragic 17.9% |
| Immigrants | Azores | 0.6 /100 | #255 | Tragic 17.9% |
| Bahamians | 0.6 /100 | #256 | Tragic 17.9% |
| Mexican American Indians | 0.6 /100 | #257 | Tragic 17.9% |
| Immigrants | Armenia | 0.6 /100 | #258 | Tragic 17.9% |
| Ethiopians | 0.5 /100 | #259 | Tragic 17.9% |
| Immigrants | Belize | 0.5 /100 | #260 | Tragic 17.9% |
| Guamanians/Chamorros | 0.5 /100 | #261 | Tragic 17.9% |
| Sierra Leoneans | 0.4 /100 | #262 | Tragic 17.9% |
| Immigrants | Barbados | 0.4 /100 | #263 | Tragic 17.9% |
| Menominee | 0.4 /100 | #264 | Tragic 18.0% |
| Spanish Americans | 0.4 /100 | #265 | Tragic 18.0% |
| Belizeans | 0.4 /100 | #266 | Tragic 18.0% |
| Nepalese | 0.3 /100 | #267 | Tragic 18.0% |
| Cherokee | 0.3 /100 | #268 | Tragic 18.0% |
Demographics Similar to Eastern Europeans by Cognitive Disability
In terms of cognitive disability, the demographic groups most similar to Eastern Europeans are Immigrants from North Macedonia (16.3%, a difference of 0.020%), Immigrants from Northern Europe (16.3%, a difference of 0.080%), Immigrants from Bolivia (16.3%, a difference of 0.090%), Bulgarian (16.3%, a difference of 0.10%), and Immigrants from Cuba (16.3%, a difference of 0.14%).
| Demographics | Rating | Rank | Cognitive Disability |
| Assyrians/Chaldeans/Syriacs | 100.0 /100 | #9 | Exceptional 16.2% |
| Immigrants | Scotland | 100.0 /100 | #10 | Exceptional 16.2% |
| Immigrants | Czechoslovakia | 100.0 /100 | #11 | Exceptional 16.2% |
| Maltese | 100.0 /100 | #12 | Exceptional 16.2% |
| Lithuanians | 100.0 /100 | #13 | Exceptional 16.3% |
| Immigrants | Austria | 100.0 /100 | #14 | Exceptional 16.3% |
| Immigrants | Greece | 100.0 /100 | #15 | Exceptional 16.3% |
| Eastern Europeans | 100.0 /100 | #16 | Exceptional 16.3% |
| Immigrants | North Macedonia | 100.0 /100 | #17 | Exceptional 16.3% |
| Immigrants | Northern Europe | 100.0 /100 | #18 | Exceptional 16.3% |
| Immigrants | Bolivia | 100.0 /100 | #19 | Exceptional 16.3% |
| Bulgarians | 100.0 /100 | #20 | Exceptional 16.3% |
| Immigrants | Cuba | 100.0 /100 | #21 | Exceptional 16.3% |
| Immigrants | South Central Asia | 99.9 /100 | #22 | Exceptional 16.4% |
| Croatians | 99.9 /100 | #23 | Exceptional 16.4% |