Lumbee vs Nicaraguan Cognitive Disability
COMPARE
Lumbee
Nicaraguan
Cognitive Disability
Cognitive Disability Comparison
Lumbee
Nicaraguans
19.1%
COGNITIVE DISABILITY
0.0/ 100
METRIC RATING
338th/ 347
METRIC RANK
17.0%
COGNITIVE DISABILITY
93.0/ 100
METRIC RATING
128th/ 347
METRIC RANK
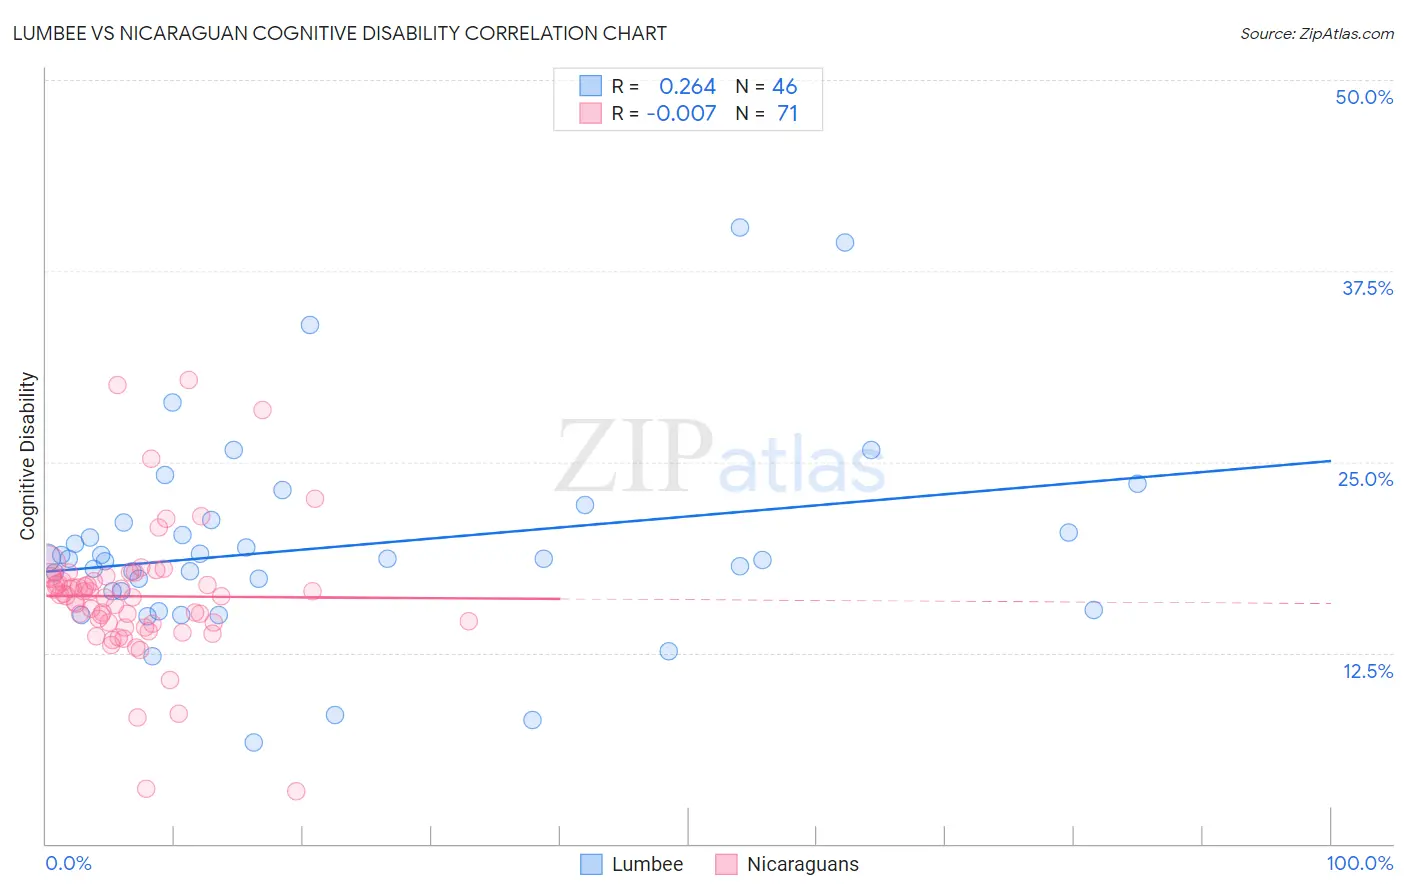
Lumbee vs Nicaraguan Cognitive Disability Correlation Chart
The statistical analysis conducted on geographies consisting of 92,289,773 people shows a weak positive correlation between the proportion of Lumbee and percentage of population with cognitive disability in the United States with a correlation coefficient (R) of 0.264 and weighted average of 19.1%. Similarly, the statistical analysis conducted on geographies consisting of 285,693,430 people shows no correlation between the proportion of Nicaraguans and percentage of population with cognitive disability in the United States with a correlation coefficient (R) of -0.007 and weighted average of 17.0%, a difference of 12.8%.
Cognitive Disability Correlation Summary
| Measurement | Lumbee | Nicaraguan |
| Minimum | 6.6% | 3.4% |
| Maximum | 40.4% | 30.4% |
| Range | 33.7% | 26.9% |
| Mean | 19.4% | 16.2% |
| Median | 18.7% | 16.2% |
| Interquartile 25% (IQ1) | 16.5% | 14.4% |
| Interquartile 75% (IQ3) | 21.0% | 17.4% |
| Interquartile Range (IQR) | 4.5% | 3.0% |
| Standard Deviation (Sample) | 6.6% | 4.4% |
| Standard Deviation (Population) | 6.5% | 4.4% |
Similar Demographics by Cognitive Disability
Demographics Similar to Lumbee by Cognitive Disability
In terms of cognitive disability, the demographic groups most similar to Lumbee are Immigrants from Saudi Arabia (19.1%, a difference of 0.34%), Black/African American (19.0%, a difference of 0.47%), Puerto Rican (19.2%, a difference of 0.47%), Cape Verdean (19.2%, a difference of 0.50%), and Tohono O'odham (19.3%, a difference of 0.74%).
| Demographics | Rating | Rank | Cognitive Disability |
| Pima | 0.0 /100 | #331 | Tragic 18.8% |
| Immigrants | Sudan | 0.0 /100 | #332 | Tragic 18.8% |
| Immigrants | Yemen | 0.0 /100 | #333 | Tragic 18.8% |
| Sudanese | 0.0 /100 | #334 | Tragic 18.9% |
| Senegalese | 0.0 /100 | #335 | Tragic 19.0% |
| Blacks/African Americans | 0.0 /100 | #336 | Tragic 19.0% |
| Immigrants | Saudi Arabia | 0.0 /100 | #337 | Tragic 19.1% |
| Lumbee | 0.0 /100 | #338 | Tragic 19.1% |
| Puerto Ricans | 0.0 /100 | #339 | Tragic 19.2% |
| Cape Verdeans | 0.0 /100 | #340 | Tragic 19.2% |
| Tohono O'odham | 0.0 /100 | #341 | Tragic 19.3% |
| Houma | 0.0 /100 | #342 | Tragic 19.3% |
| Immigrants | Zaire | 0.0 /100 | #343 | Tragic 19.4% |
| Immigrants | Congo | 0.0 /100 | #344 | Tragic 19.7% |
| Somalis | 0.0 /100 | #345 | Tragic 19.8% |
Demographics Similar to Nicaraguans by Cognitive Disability
In terms of cognitive disability, the demographic groups most similar to Nicaraguans are Immigrants from Costa Rica (17.0%, a difference of 0.010%), Immigrants from Uruguay (17.0%, a difference of 0.010%), European (17.0%, a difference of 0.050%), Immigrants from Vietnam (17.0%, a difference of 0.070%), and Immigrants from Germany (17.0%, a difference of 0.090%).
| Demographics | Rating | Rank | Cognitive Disability |
| Immigrants | China | 94.9 /100 | #121 | Exceptional 16.9% |
| Immigrants | Western Europe | 94.8 /100 | #122 | Exceptional 16.9% |
| Portuguese | 94.7 /100 | #123 | Exceptional 16.9% |
| Turks | 94.5 /100 | #124 | Exceptional 16.9% |
| Scandinavians | 94.1 /100 | #125 | Exceptional 16.9% |
| Europeans | 93.4 /100 | #126 | Exceptional 17.0% |
| Immigrants | Costa Rica | 93.1 /100 | #127 | Exceptional 17.0% |
| Nicaraguans | 93.0 /100 | #128 | Exceptional 17.0% |
| Immigrants | Uruguay | 92.9 /100 | #129 | Exceptional 17.0% |
| Immigrants | Vietnam | 92.4 /100 | #130 | Exceptional 17.0% |
| Immigrants | Germany | 92.1 /100 | #131 | Exceptional 17.0% |
| Whites/Caucasians | 92.1 /100 | #132 | Exceptional 17.0% |
| Immigrants | Jordan | 91.9 /100 | #133 | Exceptional 17.0% |
| Immigrants | Chile | 91.7 /100 | #134 | Exceptional 17.0% |
| Lebanese | 91.3 /100 | #135 | Exceptional 17.0% |