Guamanian/Chamorro vs Sioux Cognitive Disability
COMPARE
Guamanian/Chamorro
Sioux
Cognitive Disability
Cognitive Disability Comparison
Guamanians/Chamorros
Sioux
17.9%
COGNITIVE DISABILITY
0.5/ 100
METRIC RATING
261st/ 347
METRIC RANK
17.3%
COGNITIVE DISABILITY
48.6/ 100
METRIC RATING
179th/ 347
METRIC RANK
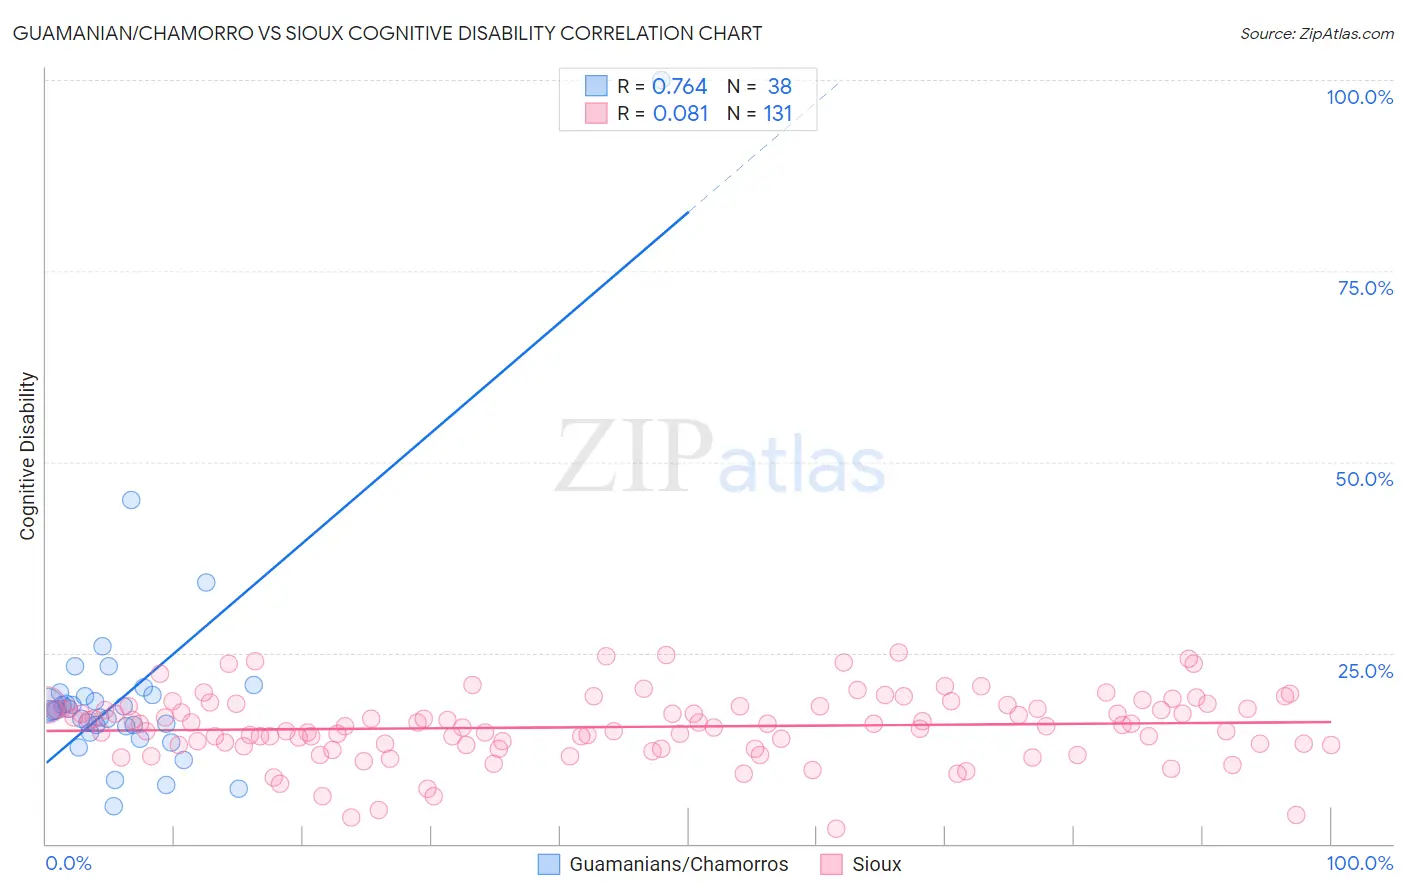
Guamanian/Chamorro vs Sioux Cognitive Disability Correlation Chart
The statistical analysis conducted on geographies consisting of 221,888,944 people shows a strong positive correlation between the proportion of Guamanians/Chamorros and percentage of population with cognitive disability in the United States with a correlation coefficient (R) of 0.764 and weighted average of 17.9%. Similarly, the statistical analysis conducted on geographies consisting of 234,153,820 people shows a slight positive correlation between the proportion of Sioux and percentage of population with cognitive disability in the United States with a correlation coefficient (R) of 0.081 and weighted average of 17.3%, a difference of 3.8%.
Cognitive Disability Correlation Summary
| Measurement | Guamanian/Chamorro | Sioux |
| Minimum | 5.0% | 1.9% |
| Maximum | 100.0% | 25.0% |
| Range | 95.0% | 23.1% |
| Mean | 19.8% | 15.3% |
| Median | 17.5% | 15.5% |
| Interquartile 25% (IQ1) | 15.4% | 12.9% |
| Interquartile 75% (IQ3) | 19.5% | 17.9% |
| Interquartile Range (IQR) | 4.0% | 5.0% |
| Standard Deviation (Sample) | 15.1% | 4.4% |
| Standard Deviation (Population) | 14.9% | 4.4% |
Similar Demographics by Cognitive Disability
Demographics Similar to Guamanians/Chamorros by Cognitive Disability
In terms of cognitive disability, the demographic groups most similar to Guamanians/Chamorros are Sierra Leonean (17.9%, a difference of 0.030%), Immigrants from Belize (17.9%, a difference of 0.050%), Ethiopian (17.9%, a difference of 0.060%), Immigrants from Barbados (17.9%, a difference of 0.070%), and Menominee (18.0%, a difference of 0.13%).
| Demographics | Rating | Rank | Cognitive Disability |
| Hispanics or Latinos | 0.6 /100 | #254 | Tragic 17.9% |
| Immigrants | Azores | 0.6 /100 | #255 | Tragic 17.9% |
| Bahamians | 0.6 /100 | #256 | Tragic 17.9% |
| Mexican American Indians | 0.6 /100 | #257 | Tragic 17.9% |
| Immigrants | Armenia | 0.6 /100 | #258 | Tragic 17.9% |
| Ethiopians | 0.5 /100 | #259 | Tragic 17.9% |
| Immigrants | Belize | 0.5 /100 | #260 | Tragic 17.9% |
| Guamanians/Chamorros | 0.5 /100 | #261 | Tragic 17.9% |
| Sierra Leoneans | 0.4 /100 | #262 | Tragic 17.9% |
| Immigrants | Barbados | 0.4 /100 | #263 | Tragic 17.9% |
| Menominee | 0.4 /100 | #264 | Tragic 18.0% |
| Spanish Americans | 0.4 /100 | #265 | Tragic 18.0% |
| Belizeans | 0.4 /100 | #266 | Tragic 18.0% |
| Nepalese | 0.3 /100 | #267 | Tragic 18.0% |
| Cherokee | 0.3 /100 | #268 | Tragic 18.0% |
Demographics Similar to Sioux by Cognitive Disability
In terms of cognitive disability, the demographic groups most similar to Sioux are Ute (17.3%, a difference of 0.010%), Spanish (17.3%, a difference of 0.010%), Shoshone (17.3%, a difference of 0.020%), Tsimshian (17.3%, a difference of 0.030%), and Laotian (17.3%, a difference of 0.040%).
| Demographics | Rating | Rank | Cognitive Disability |
| Immigrants | Turkey | 56.7 /100 | #172 | Average 17.2% |
| Immigrants | Northern Africa | 50.2 /100 | #173 | Average 17.3% |
| Laotians | 50.0 /100 | #174 | Average 17.3% |
| Tsimshian | 49.8 /100 | #175 | Average 17.3% |
| Shoshone | 49.2 /100 | #176 | Average 17.3% |
| Ute | 49.1 /100 | #177 | Average 17.3% |
| Spanish | 48.9 /100 | #178 | Average 17.3% |
| Sioux | 48.6 /100 | #179 | Average 17.3% |
| Pakistanis | 43.9 /100 | #180 | Average 17.3% |
| Immigrants | Guyana | 42.9 /100 | #181 | Average 17.3% |
| Arabs | 42.8 /100 | #182 | Average 17.3% |
| Spaniards | 40.3 /100 | #183 | Average 17.3% |
| Crow | 39.1 /100 | #184 | Fair 17.3% |
| Afghans | 38.2 /100 | #185 | Fair 17.3% |
| Cambodians | 35.9 /100 | #186 | Fair 17.3% |