Choctaw vs Aleut Disability Age Over 75
COMPARE
Choctaw
Aleut
Disability Age Over 75
Disability Age Over 75 Comparison
Choctaw
Aleuts
52.7%
DISABILITY AGE OVER 75
0.0/ 100
METRIC RATING
328th/ 347
METRIC RANK
50.6%
DISABILITY AGE OVER 75
0.0/ 100
METRIC RATING
309th/ 347
METRIC RANK
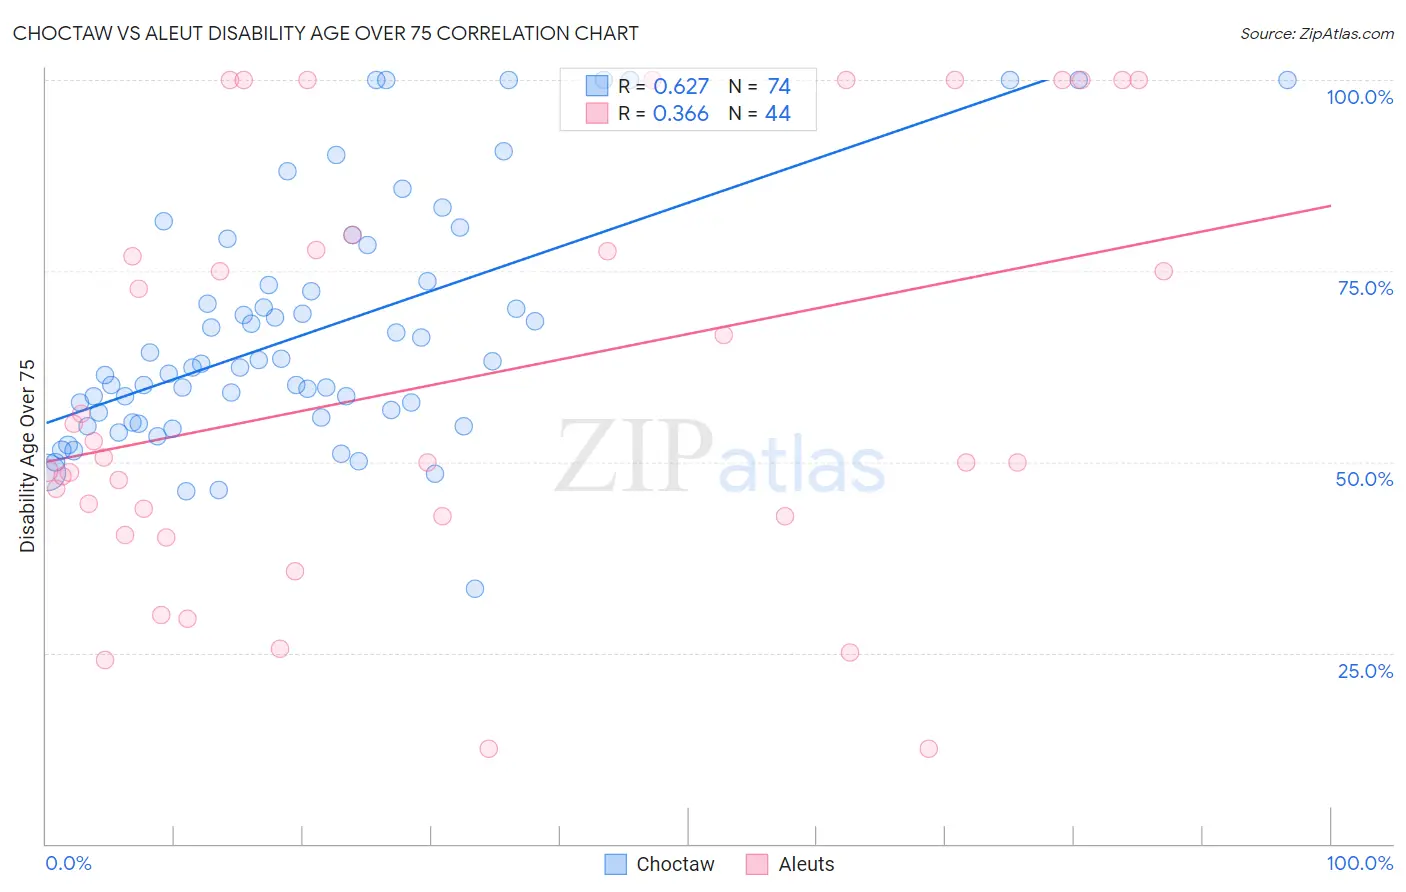
Choctaw vs Aleut Disability Age Over 75 Correlation Chart
The statistical analysis conducted on geographies consisting of 269,353,034 people shows a significant positive correlation between the proportion of Choctaw and percentage of population with a disability over the age of 75 in the United States with a correlation coefficient (R) of 0.627 and weighted average of 52.7%. Similarly, the statistical analysis conducted on geographies consisting of 61,756,409 people shows a mild positive correlation between the proportion of Aleuts and percentage of population with a disability over the age of 75 in the United States with a correlation coefficient (R) of 0.366 and weighted average of 50.6%, a difference of 4.2%.
Disability Age Over 75 Correlation Summary
| Measurement | Choctaw | Aleut |
| Minimum | 33.3% | 12.5% |
| Maximum | 100.0% | 100.0% |
| Range | 66.7% | 87.5% |
| Mean | 67.1% | 60.3% |
| Median | 62.6% | 50.3% |
| Interquartile 25% (IQ1) | 55.9% | 42.9% |
| Interquartile 75% (IQ3) | 73.7% | 78.7% |
| Interquartile Range (IQR) | 17.8% | 35.9% |
| Standard Deviation (Sample) | 15.9% | 27.1% |
| Standard Deviation (Population) | 15.8% | 26.8% |
Demographics Similar to Choctaw and Aleuts by Disability Age Over 75
In terms of disability age over 75, the demographic groups most similar to Choctaw are Nepalese (52.6%, a difference of 0.19%), Ute (52.6%, a difference of 0.22%), Immigrants from Cabo Verde (52.4%, a difference of 0.57%), Menominee (52.3%, a difference of 0.73%), and Immigrants from Yemen (52.0%, a difference of 1.4%). Similarly, the demographic groups most similar to Aleuts are Hispanic or Latino (50.6%, a difference of 0.0%), Tlingit-Haida (50.6%, a difference of 0.040%), Cajun (50.7%, a difference of 0.14%), Cheyenne (50.9%, a difference of 0.59%), and Immigrants from the Azores (50.9%, a difference of 0.64%).
| Demographics | Rating | Rank | Disability Age Over 75 |
| Hispanics or Latinos | 0.0 /100 | #308 | Tragic 50.6% |
| Aleuts | 0.0 /100 | #309 | Tragic 50.6% |
| Tlingit-Haida | 0.0 /100 | #310 | Tragic 50.6% |
| Cajuns | 0.0 /100 | #311 | Tragic 50.7% |
| Cheyenne | 0.0 /100 | #312 | Tragic 50.9% |
| Immigrants | Azores | 0.0 /100 | #313 | Tragic 50.9% |
| Immigrants | Mexico | 0.0 /100 | #314 | Tragic 51.1% |
| Mexicans | 0.0 /100 | #315 | Tragic 51.1% |
| Chickasaw | 0.0 /100 | #316 | Tragic 51.2% |
| Yakama | 0.0 /100 | #317 | Tragic 51.3% |
| Seminole | 0.0 /100 | #318 | Tragic 51.5% |
| Creek | 0.0 /100 | #319 | Tragic 51.5% |
| Paiute | 0.0 /100 | #320 | Tragic 51.5% |
| Dutch West Indians | 0.0 /100 | #321 | Tragic 51.5% |
| Comanche | 0.0 /100 | #322 | Tragic 51.7% |
| Immigrants | Yemen | 0.0 /100 | #323 | Tragic 52.0% |
| Menominee | 0.0 /100 | #324 | Tragic 52.3% |
| Immigrants | Cabo Verde | 0.0 /100 | #325 | Tragic 52.4% |
| Ute | 0.0 /100 | #326 | Tragic 52.6% |
| Nepalese | 0.0 /100 | #327 | Tragic 52.6% |
| Choctaw | 0.0 /100 | #328 | Tragic 52.7% |