Greek vs Immigrants from Laos Disability Age Under 5
COMPARE
Greek
Immigrants from Laos
Disability Age Under 5
Disability Age Under 5 Comparison
Greeks
Immigrants from Laos
1.5%
DISABILITY AGE UNDER 5
0.0/ 100
METRIC RATING
276th/ 347
METRIC RANK
1.3%
DISABILITY AGE UNDER 5
36.6/ 100
METRIC RATING
190th/ 347
METRIC RANK
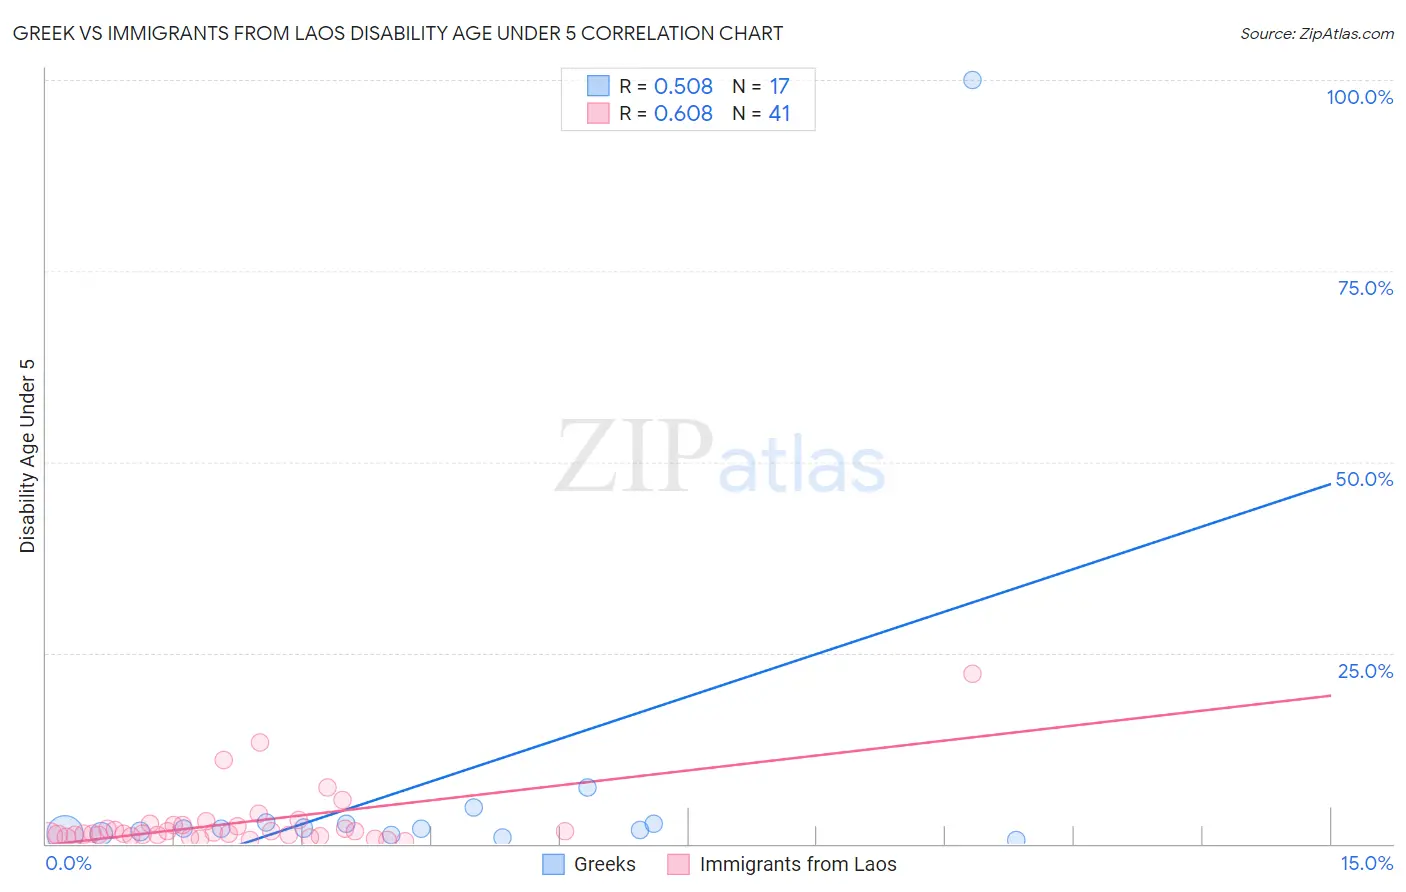
Greek vs Immigrants from Laos Disability Age Under 5 Correlation Chart
The statistical analysis conducted on geographies consisting of 239,993,794 people shows a substantial positive correlation between the proportion of Greeks and percentage of population with a disability under the age of 5 in the United States with a correlation coefficient (R) of 0.508 and weighted average of 1.5%. Similarly, the statistical analysis conducted on geographies consisting of 136,282,116 people shows a significant positive correlation between the proportion of Immigrants from Laos and percentage of population with a disability under the age of 5 in the United States with a correlation coefficient (R) of 0.608 and weighted average of 1.3%, a difference of 16.7%.
Disability Age Under 5 Correlation Summary
| Measurement | Greek | Immigrants from Laos |
| Minimum | 0.57% | 0.33% |
| Maximum | 100.0% | 22.2% |
| Range | 99.4% | 21.9% |
| Mean | 8.0% | 2.8% |
| Median | 2.0% | 1.4% |
| Interquartile 25% (IQ1) | 1.3% | 0.97% |
| Interquartile 75% (IQ3) | 2.7% | 2.4% |
| Interquartile Range (IQR) | 1.4% | 1.4% |
| Standard Deviation (Sample) | 23.8% | 4.1% |
| Standard Deviation (Population) | 23.0% | 4.0% |
Similar Demographics by Disability Age Under 5
Demographics Similar to Greeks by Disability Age Under 5
In terms of disability age under 5, the demographic groups most similar to Greeks are Brazilian (1.5%, a difference of 0.57%), Iroquois (1.5%, a difference of 0.69%), Canadian (1.5%, a difference of 0.70%), Kiowa (1.5%, a difference of 0.78%), and Danish (1.5%, a difference of 0.79%).
| Demographics | Rating | Rank | Disability Age Under 5 |
| Austrians | 0.1 /100 | #269 | Tragic 1.4% |
| Immigrants | North America | 0.1 /100 | #270 | Tragic 1.4% |
| Immigrants | Canada | 0.1 /100 | #271 | Tragic 1.4% |
| Blacks/African Americans | 0.1 /100 | #272 | Tragic 1.4% |
| Alaskan Athabascans | 0.1 /100 | #273 | Tragic 1.5% |
| Iroquois | 0.0 /100 | #274 | Tragic 1.5% |
| Brazilians | 0.0 /100 | #275 | Tragic 1.5% |
| Greeks | 0.0 /100 | #276 | Tragic 1.5% |
| Canadians | 0.0 /100 | #277 | Tragic 1.5% |
| Kiowa | 0.0 /100 | #278 | Tragic 1.5% |
| Danes | 0.0 /100 | #279 | Tragic 1.5% |
| British | 0.0 /100 | #280 | Tragic 1.5% |
| Czechoslovakians | 0.0 /100 | #281 | Tragic 1.5% |
| Cheyenne | 0.0 /100 | #282 | Tragic 1.5% |
| Delaware | 0.0 /100 | #283 | Tragic 1.5% |
Demographics Similar to Immigrants from Laos by Disability Age Under 5
In terms of disability age under 5, the demographic groups most similar to Immigrants from Laos are Mexican American Indian (1.3%, a difference of 0.010%), Immigrants from Bosnia and Herzegovina (1.3%, a difference of 0.010%), Immigrants from Sierra Leone (1.3%, a difference of 0.010%), Peruvian (1.3%, a difference of 0.090%), and Immigrants from North Macedonia (1.3%, a difference of 0.19%).
| Demographics | Rating | Rank | Disability Age Under 5 |
| Immigrants | Saudi Arabia | 43.3 /100 | #183 | Average 1.2% |
| Palestinians | 43.0 /100 | #184 | Average 1.2% |
| Immigrants | Western Africa | 42.5 /100 | #185 | Average 1.2% |
| Cubans | 42.5 /100 | #186 | Average 1.2% |
| Immigrants | Haiti | 40.2 /100 | #187 | Average 1.3% |
| Haitians | 39.9 /100 | #188 | Fair 1.3% |
| Peruvians | 37.6 /100 | #189 | Fair 1.3% |
| Immigrants | Laos | 36.6 /100 | #190 | Fair 1.3% |
| Mexican American Indians | 36.6 /100 | #191 | Fair 1.3% |
| Immigrants | Bosnia and Herzegovina | 36.5 /100 | #192 | Fair 1.3% |
| Immigrants | Sierra Leone | 36.5 /100 | #193 | Fair 1.3% |
| Immigrants | North Macedonia | 34.7 /100 | #194 | Fair 1.3% |
| U.S. Virgin Islanders | 34.4 /100 | #195 | Fair 1.3% |
| Immigrants | Belgium | 31.4 /100 | #196 | Fair 1.3% |
| Immigrants | Somalia | 31.3 /100 | #197 | Fair 1.3% |