Immigrants from Ireland vs Immigrants from Laos Disability Age Under 5
COMPARE
Immigrants from Ireland
Immigrants from Laos
Disability Age Under 5
Disability Age Under 5 Comparison
Immigrants from Ireland
Immigrants from Laos
1.2%
DISABILITY AGE UNDER 5
50.3/ 100
METRIC RATING
173rd/ 347
METRIC RANK
1.3%
DISABILITY AGE UNDER 5
36.6/ 100
METRIC RATING
190th/ 347
METRIC RANK
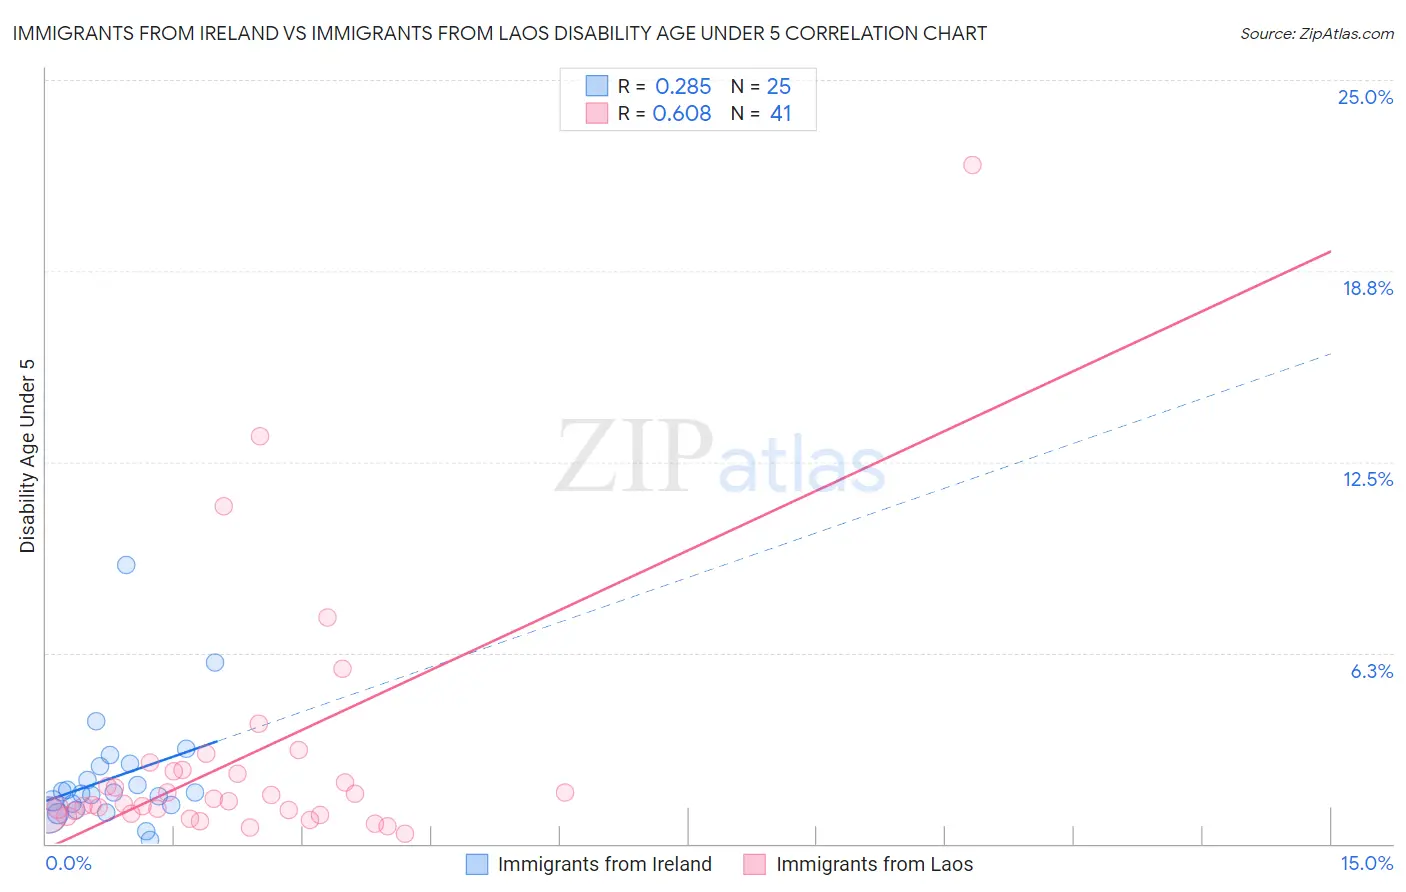
Immigrants from Ireland vs Immigrants from Laos Disability Age Under 5 Correlation Chart
The statistical analysis conducted on geographies consisting of 143,988,066 people shows a weak positive correlation between the proportion of Immigrants from Ireland and percentage of population with a disability under the age of 5 in the United States with a correlation coefficient (R) of 0.285 and weighted average of 1.2%. Similarly, the statistical analysis conducted on geographies consisting of 136,282,116 people shows a significant positive correlation between the proportion of Immigrants from Laos and percentage of population with a disability under the age of 5 in the United States with a correlation coefficient (R) of 0.608 and weighted average of 1.3%, a difference of 1.3%.
Disability Age Under 5 Correlation Summary
| Measurement | Immigrants from Ireland | Immigrants from Laos |
| Minimum | 0.14% | 0.33% |
| Maximum | 9.1% | 22.2% |
| Range | 9.0% | 21.9% |
| Mean | 2.2% | 2.8% |
| Median | 1.7% | 1.4% |
| Interquartile 25% (IQ1) | 1.2% | 0.97% |
| Interquartile 75% (IQ3) | 2.6% | 2.4% |
| Interquartile Range (IQR) | 1.4% | 1.4% |
| Standard Deviation (Sample) | 1.9% | 4.1% |
| Standard Deviation (Population) | 1.8% | 4.0% |
Demographics Similar to Immigrants from Ireland and Immigrants from Laos by Disability Age Under 5
In terms of disability age under 5, the demographic groups most similar to Immigrants from Ireland are Immigrants from Latvia (1.2%, a difference of 0.020%), Immigrants from Nigeria (1.2%, a difference of 0.030%), Crow (1.2%, a difference of 0.070%), Immigrants from Kenya (1.2%, a difference of 0.15%), and Comanche (1.2%, a difference of 0.25%). Similarly, the demographic groups most similar to Immigrants from Laos are Mexican American Indian (1.3%, a difference of 0.010%), Peruvian (1.3%, a difference of 0.090%), Haitian (1.3%, a difference of 0.31%), Immigrants from Haiti (1.3%, a difference of 0.34%), and Immigrants from Western Africa (1.2%, a difference of 0.55%).
| Demographics | Rating | Rank | Disability Age Under 5 |
| Guamanians/Chamorros | 57.8 /100 | #171 | Average 1.2% |
| Crow | 51.0 /100 | #172 | Average 1.2% |
| Immigrants | Ireland | 50.3 /100 | #173 | Average 1.2% |
| Immigrants | Latvia | 50.0 /100 | #174 | Average 1.2% |
| Immigrants | Nigeria | 50.0 /100 | #175 | Average 1.2% |
| Immigrants | Kenya | 48.6 /100 | #176 | Average 1.2% |
| Comanche | 47.5 /100 | #177 | Average 1.2% |
| Venezuelans | 47.1 /100 | #178 | Average 1.2% |
| Immigrants | Bahamas | 45.2 /100 | #179 | Average 1.2% |
| Immigrants | Mexico | 44.4 /100 | #180 | Average 1.2% |
| Macedonians | 43.7 /100 | #181 | Average 1.2% |
| Immigrants | Peru | 43.7 /100 | #181 | Average 1.2% |
| Immigrants | Saudi Arabia | 43.3 /100 | #183 | Average 1.2% |
| Palestinians | 43.0 /100 | #184 | Average 1.2% |
| Immigrants | Western Africa | 42.5 /100 | #185 | Average 1.2% |
| Cubans | 42.5 /100 | #186 | Average 1.2% |
| Immigrants | Haiti | 40.2 /100 | #187 | Average 1.3% |
| Haitians | 39.9 /100 | #188 | Fair 1.3% |
| Peruvians | 37.6 /100 | #189 | Fair 1.3% |
| Immigrants | Laos | 36.6 /100 | #190 | Fair 1.3% |
| Mexican American Indians | 36.6 /100 | #191 | Fair 1.3% |