Greek vs Jamaican Disability Age Under 5
COMPARE
Greek
Jamaican
Disability Age Under 5
Disability Age Under 5 Comparison
Greeks
Jamaicans
1.5%
DISABILITY AGE UNDER 5
0.0/ 100
METRIC RATING
276th/ 347
METRIC RANK
1.3%
DISABILITY AGE UNDER 5
30.7/ 100
METRIC RATING
199th/ 347
METRIC RANK
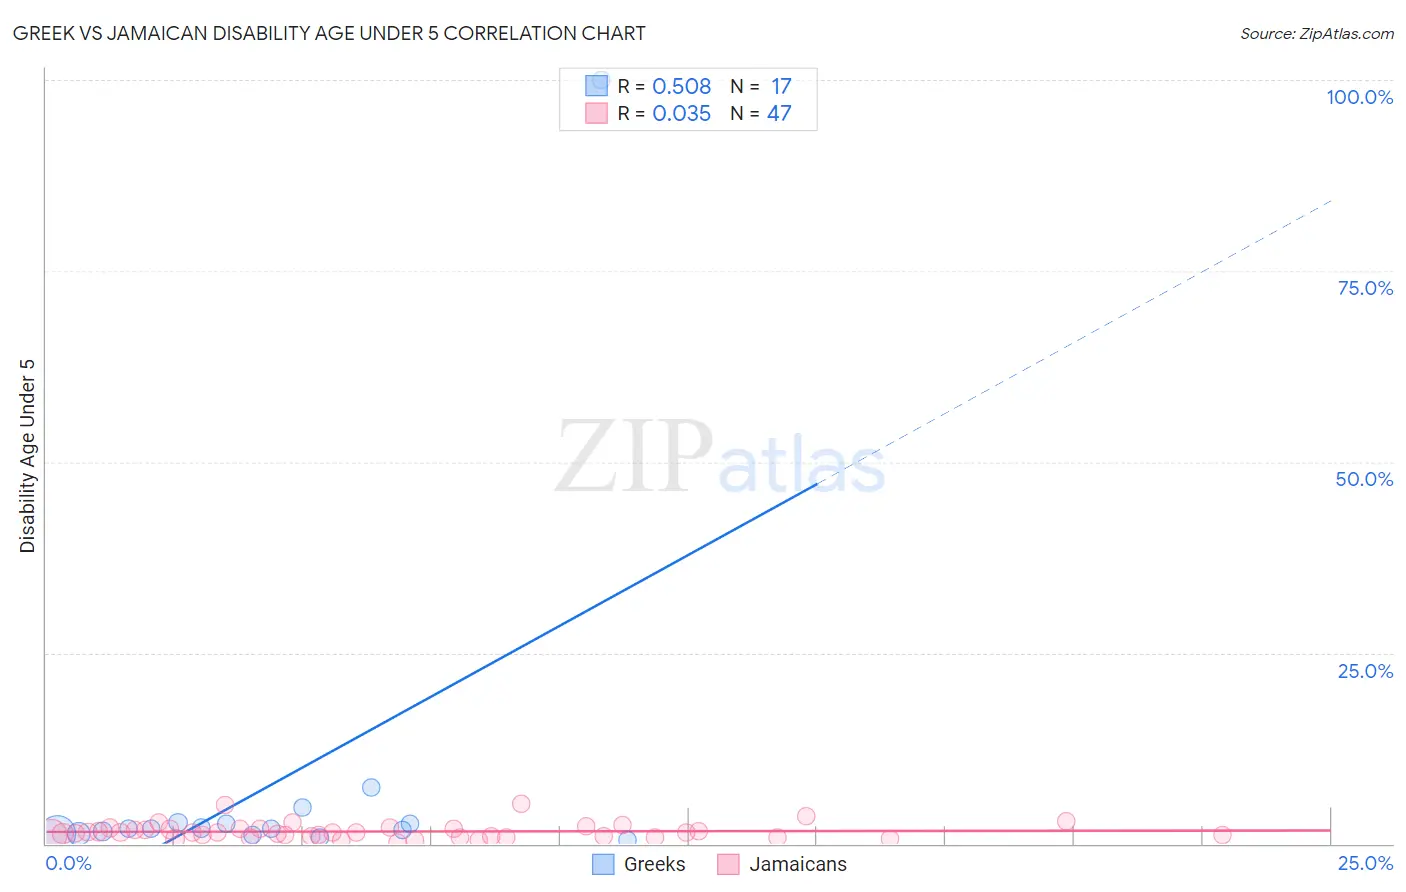
Greek vs Jamaican Disability Age Under 5 Correlation Chart
The statistical analysis conducted on geographies consisting of 239,993,794 people shows a substantial positive correlation between the proportion of Greeks and percentage of population with a disability under the age of 5 in the United States with a correlation coefficient (R) of 0.508 and weighted average of 1.5%. Similarly, the statistical analysis conducted on geographies consisting of 204,154,709 people shows no correlation between the proportion of Jamaicans and percentage of population with a disability under the age of 5 in the United States with a correlation coefficient (R) of 0.035 and weighted average of 1.3%, a difference of 16.0%.
Disability Age Under 5 Correlation Summary
| Measurement | Greek | Jamaican |
| Minimum | 0.57% | 0.17% |
| Maximum | 100.0% | 5.3% |
| Range | 99.4% | 5.1% |
| Mean | 8.0% | 1.6% |
| Median | 2.0% | 1.5% |
| Interquartile 25% (IQ1) | 1.3% | 0.93% |
| Interquartile 75% (IQ3) | 2.7% | 1.9% |
| Interquartile Range (IQR) | 1.4% | 0.95% |
| Standard Deviation (Sample) | 23.8% | 1.0% |
| Standard Deviation (Population) | 23.0% | 1.0% |
Similar Demographics by Disability Age Under 5
Demographics Similar to Greeks by Disability Age Under 5
In terms of disability age under 5, the demographic groups most similar to Greeks are Brazilian (1.5%, a difference of 0.57%), Iroquois (1.5%, a difference of 0.69%), Canadian (1.5%, a difference of 0.70%), Kiowa (1.5%, a difference of 0.78%), and Danish (1.5%, a difference of 0.79%).
| Demographics | Rating | Rank | Disability Age Under 5 |
| Austrians | 0.1 /100 | #269 | Tragic 1.4% |
| Immigrants | North America | 0.1 /100 | #270 | Tragic 1.4% |
| Immigrants | Canada | 0.1 /100 | #271 | Tragic 1.4% |
| Blacks/African Americans | 0.1 /100 | #272 | Tragic 1.4% |
| Alaskan Athabascans | 0.1 /100 | #273 | Tragic 1.5% |
| Iroquois | 0.0 /100 | #274 | Tragic 1.5% |
| Brazilians | 0.0 /100 | #275 | Tragic 1.5% |
| Greeks | 0.0 /100 | #276 | Tragic 1.5% |
| Canadians | 0.0 /100 | #277 | Tragic 1.5% |
| Kiowa | 0.0 /100 | #278 | Tragic 1.5% |
| Danes | 0.0 /100 | #279 | Tragic 1.5% |
| British | 0.0 /100 | #280 | Tragic 1.5% |
| Czechoslovakians | 0.0 /100 | #281 | Tragic 1.5% |
| Cheyenne | 0.0 /100 | #282 | Tragic 1.5% |
| Delaware | 0.0 /100 | #283 | Tragic 1.5% |
Demographics Similar to Jamaicans by Disability Age Under 5
In terms of disability age under 5, the demographic groups most similar to Jamaicans are Immigrants from Norway (1.3%, a difference of 0.040%), Immigrants from Somalia (1.3%, a difference of 0.070%), Immigrants from Belgium (1.3%, a difference of 0.080%), U.S. Virgin Islander (1.3%, a difference of 0.38%), and Immigrants from Lithuania (1.3%, a difference of 0.38%).
| Demographics | Rating | Rank | Disability Age Under 5 |
| Immigrants | Bosnia and Herzegovina | 36.5 /100 | #192 | Fair 1.3% |
| Immigrants | Sierra Leone | 36.5 /100 | #193 | Fair 1.3% |
| Immigrants | North Macedonia | 34.7 /100 | #194 | Fair 1.3% |
| U.S. Virgin Islanders | 34.4 /100 | #195 | Fair 1.3% |
| Immigrants | Belgium | 31.4 /100 | #196 | Fair 1.3% |
| Immigrants | Somalia | 31.3 /100 | #197 | Fair 1.3% |
| Immigrants | Norway | 31.1 /100 | #198 | Fair 1.3% |
| Jamaicans | 30.7 /100 | #199 | Fair 1.3% |
| Immigrants | Lithuania | 27.2 /100 | #200 | Fair 1.3% |
| Immigrants | Italy | 25.4 /100 | #201 | Fair 1.3% |
| Arapaho | 24.1 /100 | #202 | Fair 1.3% |
| Liberians | 24.0 /100 | #203 | Fair 1.3% |
| Immigrants | Europe | 23.6 /100 | #204 | Fair 1.3% |
| Romanians | 22.5 /100 | #205 | Fair 1.3% |
| Immigrants | Poland | 22.4 /100 | #206 | Fair 1.3% |