Greek vs Immigrants from Lebanon Disability Age Under 5
COMPARE
Greek
Immigrants from Lebanon
Disability Age Under 5
Disability Age Under 5 Comparison
Greeks
Immigrants from Lebanon
1.5%
DISABILITY AGE UNDER 5
0.0/ 100
METRIC RATING
276th/ 347
METRIC RANK
1.2%
DISABILITY AGE UNDER 5
95.0/ 100
METRIC RATING
110th/ 347
METRIC RANK
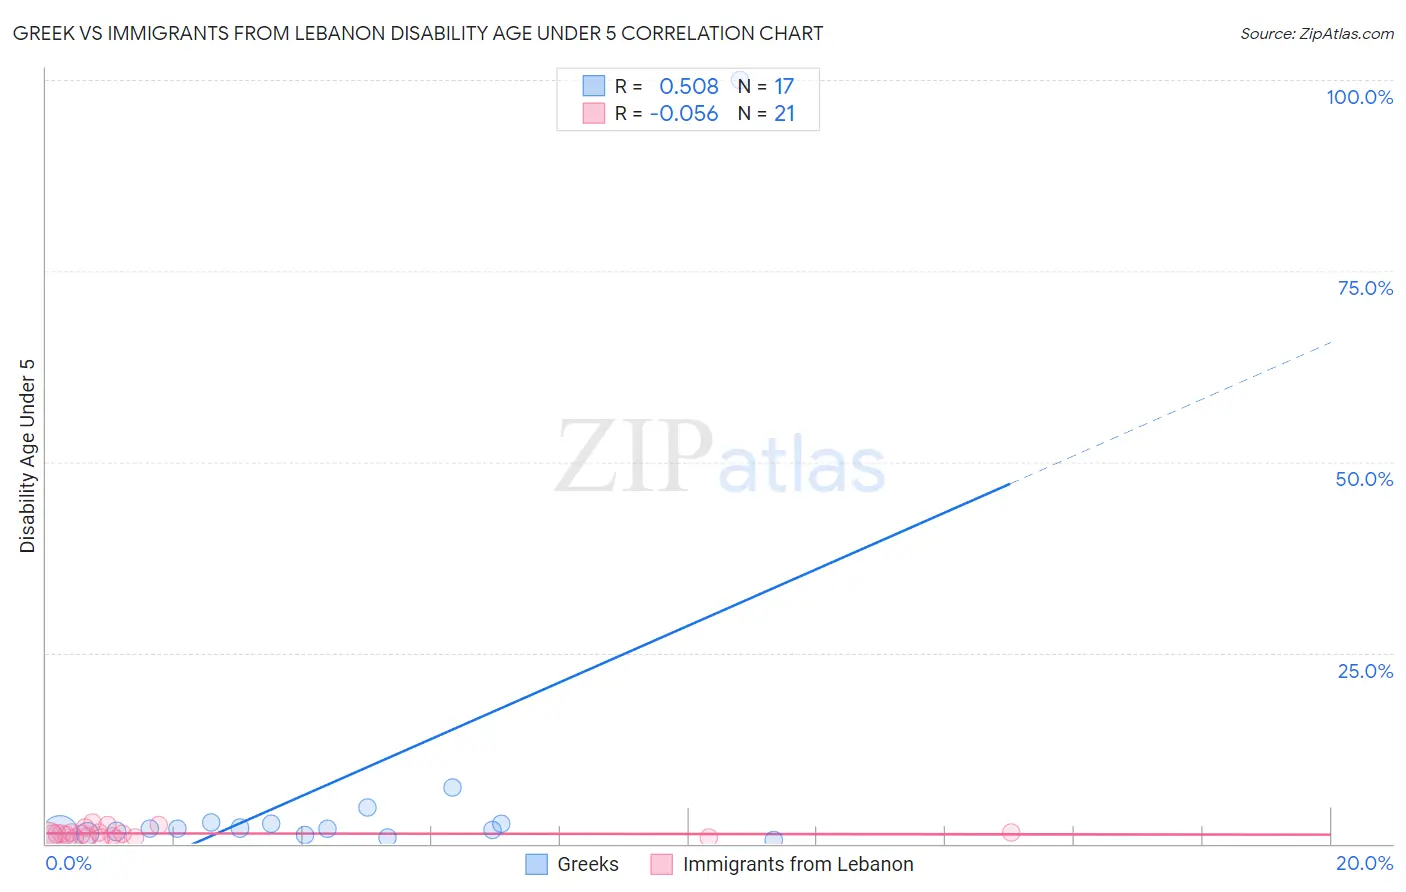
Greek vs Immigrants from Lebanon Disability Age Under 5 Correlation Chart
The statistical analysis conducted on geographies consisting of 239,993,794 people shows a substantial positive correlation between the proportion of Greeks and percentage of population with a disability under the age of 5 in the United States with a correlation coefficient (R) of 0.508 and weighted average of 1.5%. Similarly, the statistical analysis conducted on geographies consisting of 139,551,916 people shows a slight negative correlation between the proportion of Immigrants from Lebanon and percentage of population with a disability under the age of 5 in the United States with a correlation coefficient (R) of -0.056 and weighted average of 1.2%, a difference of 26.5%.
Disability Age Under 5 Correlation Summary
| Measurement | Greek | Immigrants from Lebanon |
| Minimum | 0.57% | 0.69% |
| Maximum | 100.0% | 2.8% |
| Range | 99.4% | 2.1% |
| Mean | 8.0% | 1.4% |
| Median | 2.0% | 1.2% |
| Interquartile 25% (IQ1) | 1.3% | 0.90% |
| Interquartile 75% (IQ3) | 2.7% | 1.5% |
| Interquartile Range (IQR) | 1.4% | 0.57% |
| Standard Deviation (Sample) | 23.8% | 0.59% |
| Standard Deviation (Population) | 23.0% | 0.58% |
Similar Demographics by Disability Age Under 5
Demographics Similar to Greeks by Disability Age Under 5
In terms of disability age under 5, the demographic groups most similar to Greeks are Brazilian (1.5%, a difference of 0.57%), Iroquois (1.5%, a difference of 0.69%), Canadian (1.5%, a difference of 0.70%), Kiowa (1.5%, a difference of 0.78%), and Danish (1.5%, a difference of 0.79%).
| Demographics | Rating | Rank | Disability Age Under 5 |
| Austrians | 0.1 /100 | #269 | Tragic 1.4% |
| Immigrants | North America | 0.1 /100 | #270 | Tragic 1.4% |
| Immigrants | Canada | 0.1 /100 | #271 | Tragic 1.4% |
| Blacks/African Americans | 0.1 /100 | #272 | Tragic 1.4% |
| Alaskan Athabascans | 0.1 /100 | #273 | Tragic 1.5% |
| Iroquois | 0.0 /100 | #274 | Tragic 1.5% |
| Brazilians | 0.0 /100 | #275 | Tragic 1.5% |
| Greeks | 0.0 /100 | #276 | Tragic 1.5% |
| Canadians | 0.0 /100 | #277 | Tragic 1.5% |
| Kiowa | 0.0 /100 | #278 | Tragic 1.5% |
| Danes | 0.0 /100 | #279 | Tragic 1.5% |
| British | 0.0 /100 | #280 | Tragic 1.5% |
| Czechoslovakians | 0.0 /100 | #281 | Tragic 1.5% |
| Cheyenne | 0.0 /100 | #282 | Tragic 1.5% |
| Delaware | 0.0 /100 | #283 | Tragic 1.5% |
Demographics Similar to Immigrants from Lebanon by Disability Age Under 5
In terms of disability age under 5, the demographic groups most similar to Immigrants from Lebanon are Immigrants from Panama (1.2%, a difference of 0.020%), Iraqi (1.2%, a difference of 0.040%), Immigrants from West Indies (1.2%, a difference of 0.17%), Senegalese (1.2%, a difference of 0.20%), and Cambodian (1.2%, a difference of 0.21%).
| Demographics | Rating | Rank | Disability Age Under 5 |
| Immigrants | Nicaragua | 96.0 /100 | #103 | Exceptional 1.2% |
| Indonesians | 95.9 /100 | #104 | Exceptional 1.2% |
| Immigrants | South Africa | 95.6 /100 | #105 | Exceptional 1.2% |
| Cambodians | 95.4 /100 | #106 | Exceptional 1.2% |
| Immigrants | West Indies | 95.3 /100 | #107 | Exceptional 1.2% |
| Iraqis | 95.1 /100 | #108 | Exceptional 1.2% |
| Immigrants | Panama | 95.0 /100 | #109 | Exceptional 1.2% |
| Immigrants | Lebanon | 95.0 /100 | #110 | Exceptional 1.2% |
| Senegalese | 94.6 /100 | #111 | Exceptional 1.2% |
| Immigrants | Australia | 94.4 /100 | #112 | Exceptional 1.2% |
| Immigrants | Oceania | 94.2 /100 | #113 | Exceptional 1.2% |
| Belizeans | 93.9 /100 | #114 | Exceptional 1.2% |
| Immigrants | Caribbean | 93.8 /100 | #115 | Exceptional 1.2% |
| Immigrants | Northern Africa | 93.8 /100 | #116 | Exceptional 1.2% |
| Immigrants | Philippines | 93.5 /100 | #117 | Exceptional 1.2% |