Immigrants from Malaysia vs Immigrants from Laos Disability Age Under 5
COMPARE
Immigrants from Malaysia
Immigrants from Laos
Disability Age Under 5
Disability Age Under 5 Comparison
Immigrants from Malaysia
Immigrants from Laos
1.1%
DISABILITY AGE UNDER 5
99.4/ 100
METRIC RATING
59th/ 347
METRIC RANK
1.3%
DISABILITY AGE UNDER 5
36.6/ 100
METRIC RATING
190th/ 347
METRIC RANK
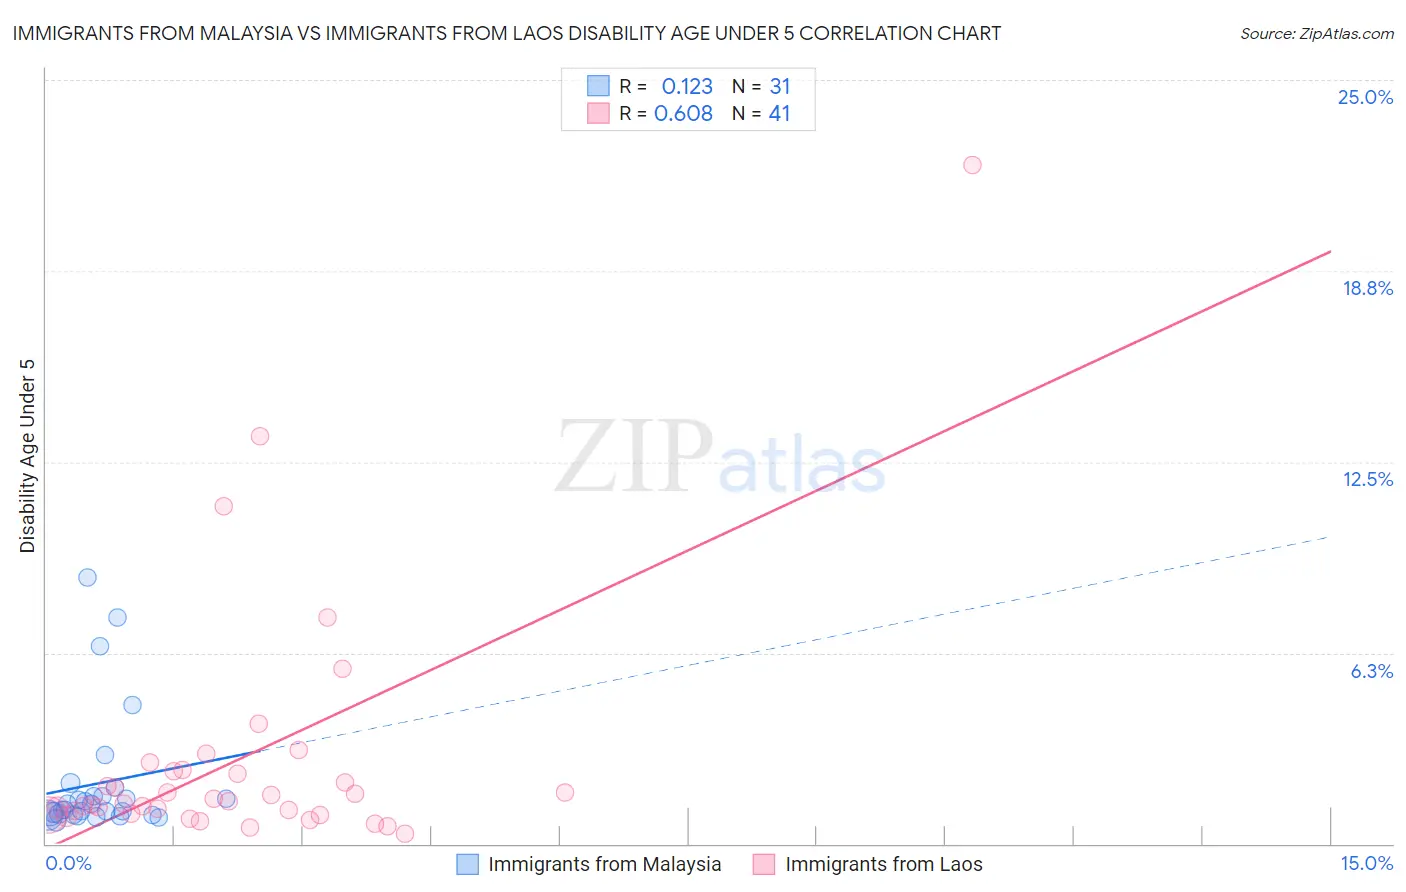
Immigrants from Malaysia vs Immigrants from Laos Disability Age Under 5 Correlation Chart
The statistical analysis conducted on geographies consisting of 132,664,021 people shows a poor positive correlation between the proportion of Immigrants from Malaysia and percentage of population with a disability under the age of 5 in the United States with a correlation coefficient (R) of 0.123 and weighted average of 1.1%. Similarly, the statistical analysis conducted on geographies consisting of 136,282,116 people shows a significant positive correlation between the proportion of Immigrants from Laos and percentage of population with a disability under the age of 5 in the United States with a correlation coefficient (R) of 0.608 and weighted average of 1.3%, a difference of 14.4%.
Disability Age Under 5 Correlation Summary
| Measurement | Immigrants from Malaysia | Immigrants from Laos |
| Minimum | 0.76% | 0.33% |
| Maximum | 8.7% | 22.2% |
| Range | 7.9% | 21.9% |
| Mean | 2.0% | 2.8% |
| Median | 1.1% | 1.4% |
| Interquartile 25% (IQ1) | 0.95% | 0.97% |
| Interquartile 75% (IQ3) | 1.6% | 2.4% |
| Interquartile Range (IQR) | 0.61% | 1.4% |
| Standard Deviation (Sample) | 2.0% | 4.1% |
| Standard Deviation (Population) | 2.0% | 4.0% |
Similar Demographics by Disability Age Under 5
Demographics Similar to Immigrants from Malaysia by Disability Age Under 5
In terms of disability age under 5, the demographic groups most similar to Immigrants from Malaysia are Immigrants from Egypt (1.1%, a difference of 0.12%), Assyrian/Chaldean/Syriac (1.1%, a difference of 0.30%), Ecuadorian (1.1%, a difference of 0.33%), Salvadoran (1.1%, a difference of 0.73%), and Immigrants from Western Asia (1.1%, a difference of 0.76%).
| Demographics | Rating | Rank | Disability Age Under 5 |
| Immigrants | Bolivia | 99.6 /100 | #52 | Exceptional 1.1% |
| Asians | 99.6 /100 | #53 | Exceptional 1.1% |
| Immigrants | El Salvador | 99.6 /100 | #54 | Exceptional 1.1% |
| Salvadorans | 99.5 /100 | #55 | Exceptional 1.1% |
| Ecuadorians | 99.5 /100 | #56 | Exceptional 1.1% |
| Assyrians/Chaldeans/Syriacs | 99.5 /100 | #57 | Exceptional 1.1% |
| Immigrants | Egypt | 99.4 /100 | #58 | Exceptional 1.1% |
| Immigrants | Malaysia | 99.4 /100 | #59 | Exceptional 1.1% |
| Immigrants | Western Asia | 99.2 /100 | #60 | Exceptional 1.1% |
| Immigrants | Ethiopia | 99.2 /100 | #61 | Exceptional 1.1% |
| Immigrants | Switzerland | 99.2 /100 | #62 | Exceptional 1.1% |
| Immigrants | Vietnam | 99.1 /100 | #63 | Exceptional 1.1% |
| Egyptians | 98.9 /100 | #64 | Exceptional 1.1% |
| Immigrants | Korea | 98.8 /100 | #65 | Exceptional 1.1% |
| Immigrants | Indonesia | 98.7 /100 | #66 | Exceptional 1.1% |
Demographics Similar to Immigrants from Laos by Disability Age Under 5
In terms of disability age under 5, the demographic groups most similar to Immigrants from Laos are Mexican American Indian (1.3%, a difference of 0.010%), Immigrants from Bosnia and Herzegovina (1.3%, a difference of 0.010%), Immigrants from Sierra Leone (1.3%, a difference of 0.010%), Peruvian (1.3%, a difference of 0.090%), and Immigrants from North Macedonia (1.3%, a difference of 0.19%).
| Demographics | Rating | Rank | Disability Age Under 5 |
| Immigrants | Saudi Arabia | 43.3 /100 | #183 | Average 1.2% |
| Palestinians | 43.0 /100 | #184 | Average 1.2% |
| Immigrants | Western Africa | 42.5 /100 | #185 | Average 1.2% |
| Cubans | 42.5 /100 | #186 | Average 1.2% |
| Immigrants | Haiti | 40.2 /100 | #187 | Average 1.3% |
| Haitians | 39.9 /100 | #188 | Fair 1.3% |
| Peruvians | 37.6 /100 | #189 | Fair 1.3% |
| Immigrants | Laos | 36.6 /100 | #190 | Fair 1.3% |
| Mexican American Indians | 36.6 /100 | #191 | Fair 1.3% |
| Immigrants | Bosnia and Herzegovina | 36.5 /100 | #192 | Fair 1.3% |
| Immigrants | Sierra Leone | 36.5 /100 | #193 | Fair 1.3% |
| Immigrants | North Macedonia | 34.7 /100 | #194 | Fair 1.3% |
| U.S. Virgin Islanders | 34.4 /100 | #195 | Fair 1.3% |
| Immigrants | Belgium | 31.4 /100 | #196 | Fair 1.3% |
| Immigrants | Somalia | 31.3 /100 | #197 | Fair 1.3% |