Greek vs Immigrants from Laos Median Earnings
COMPARE
Greek
Immigrants from Laos
Median Earnings
Median Earnings Comparison
Greeks
Immigrants from Laos
$51,164
MEDIAN EARNINGS
99.9/ 100
METRIC RATING
65th/ 347
METRIC RANK
$42,884
MEDIAN EARNINGS
0.7/ 100
METRIC RATING
266th/ 347
METRIC RANK
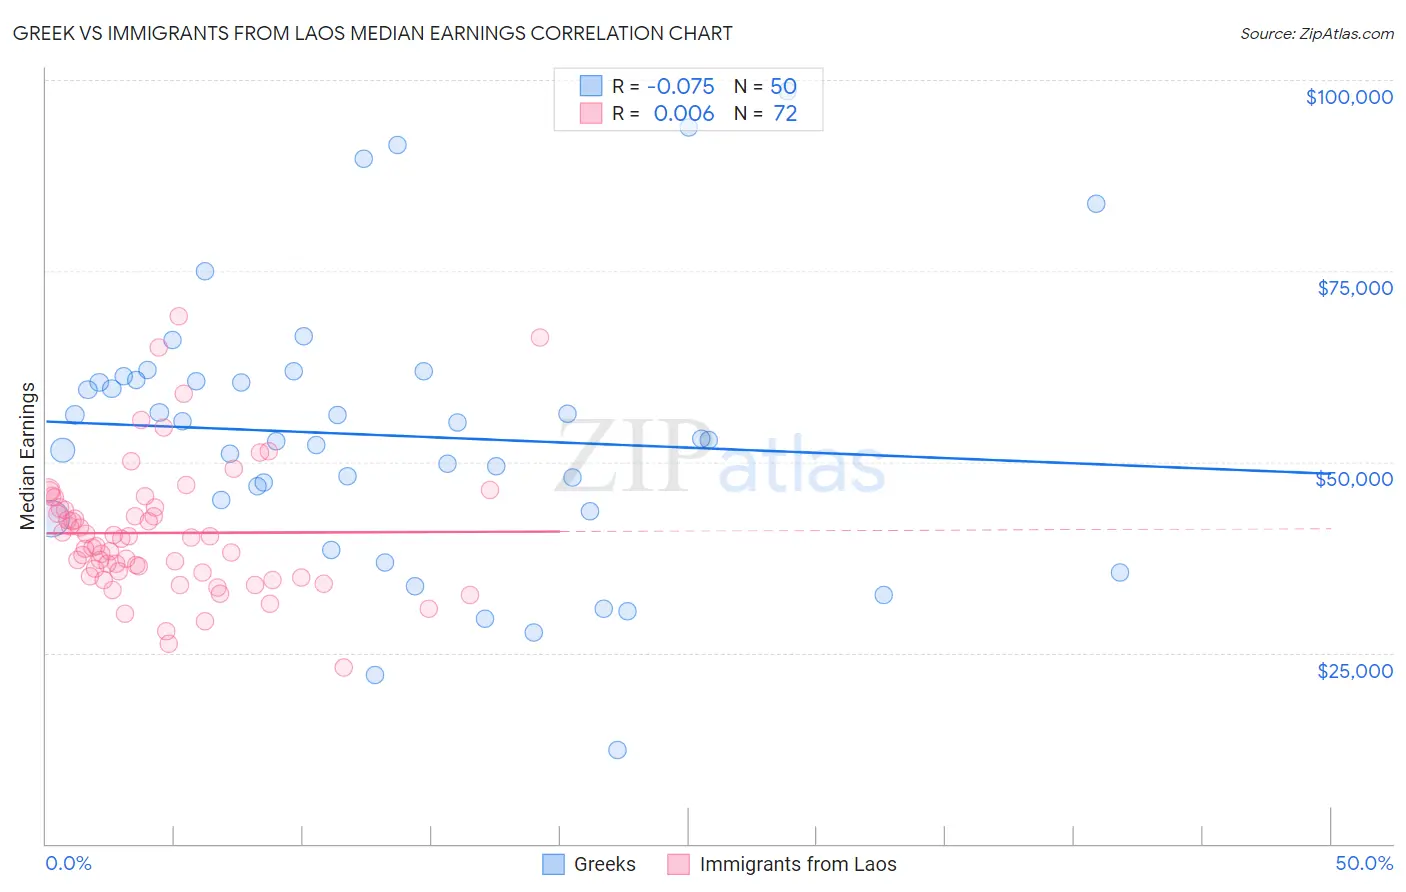
Greek vs Immigrants from Laos Median Earnings Correlation Chart
The statistical analysis conducted on geographies consisting of 482,719,843 people shows a slight negative correlation between the proportion of Greeks and median earnings in the United States with a correlation coefficient (R) of -0.075 and weighted average of $51,164. Similarly, the statistical analysis conducted on geographies consisting of 201,460,807 people shows no correlation between the proportion of Immigrants from Laos and median earnings in the United States with a correlation coefficient (R) of 0.006 and weighted average of $42,884, a difference of 19.3%.
Median Earnings Correlation Summary
| Measurement | Greek | Immigrants from Laos |
| Minimum | $12,321 | $23,015 |
| Maximum | $98,462 | $69,036 |
| Range | $86,141 | $46,021 |
| Mean | $53,439 | $40,698 |
| Median | $52,981 | $39,398 |
| Interquartile 25% (IQ1) | $43,544 | $35,289 |
| Interquartile 75% (IQ3) | $60,703 | $43,967 |
| Interquartile Range (IQR) | $17,159 | $8,679 |
| Standard Deviation (Sample) | $17,942 | $8,643 |
| Standard Deviation (Population) | $17,762 | $8,583 |
Similar Demographics by Median Earnings
Demographics Similar to Greeks by Median Earnings
In terms of median earnings, the demographic groups most similar to Greeks are Afghan ($51,112, a difference of 0.10%), Immigrants from Spain ($51,092, a difference of 0.14%), New Zealander ($51,246, a difference of 0.16%), Paraguayan ($51,068, a difference of 0.19%), and Mongolian ($51,038, a difference of 0.25%).
| Demographics | Rating | Rank | Median Earnings |
| Immigrants | Bolivia | 99.9 /100 | #58 | Exceptional $51,605 |
| Immigrants | Croatia | 99.9 /100 | #59 | Exceptional $51,581 |
| Immigrants | Serbia | 99.9 /100 | #60 | Exceptional $51,557 |
| Immigrants | Latvia | 99.9 /100 | #61 | Exceptional $51,555 |
| Immigrants | Romania | 99.9 /100 | #62 | Exceptional $51,337 |
| Immigrants | Bulgaria | 99.9 /100 | #63 | Exceptional $51,318 |
| New Zealanders | 99.9 /100 | #64 | Exceptional $51,246 |
| Greeks | 99.9 /100 | #65 | Exceptional $51,164 |
| Afghans | 99.9 /100 | #66 | Exceptional $51,112 |
| Immigrants | Spain | 99.9 /100 | #67 | Exceptional $51,092 |
| Paraguayans | 99.9 /100 | #68 | Exceptional $51,068 |
| Mongolians | 99.8 /100 | #69 | Exceptional $51,038 |
| Lithuanians | 99.8 /100 | #70 | Exceptional $50,991 |
| Immigrants | Ukraine | 99.8 /100 | #71 | Exceptional $50,984 |
| Immigrants | Egypt | 99.8 /100 | #72 | Exceptional $50,901 |
Demographics Similar to Immigrants from Laos by Median Earnings
In terms of median earnings, the demographic groups most similar to Immigrants from Laos are Salvadoran ($42,912, a difference of 0.060%), Immigrants from Liberia ($42,923, a difference of 0.090%), Cree ($42,777, a difference of 0.25%), Inupiat ($43,000, a difference of 0.27%), and Immigrants from Jamaica ($43,026, a difference of 0.33%).
| Demographics | Rating | Rank | Median Earnings |
| German Russians | 1.1 /100 | #259 | Tragic $43,200 |
| Immigrants | Somalia | 0.9 /100 | #260 | Tragic $43,100 |
| Immigrants | Jamaica | 0.8 /100 | #261 | Tragic $43,026 |
| Nicaraguans | 0.8 /100 | #262 | Tragic $43,026 |
| Inupiat | 0.8 /100 | #263 | Tragic $43,000 |
| Immigrants | Liberia | 0.7 /100 | #264 | Tragic $42,923 |
| Salvadorans | 0.7 /100 | #265 | Tragic $42,912 |
| Immigrants | Laos | 0.7 /100 | #266 | Tragic $42,884 |
| Cree | 0.6 /100 | #267 | Tragic $42,777 |
| Americans | 0.6 /100 | #268 | Tragic $42,742 |
| Belizeans | 0.5 /100 | #269 | Tragic $42,702 |
| Osage | 0.5 /100 | #270 | Tragic $42,651 |
| Pennsylvania Germans | 0.5 /100 | #271 | Tragic $42,615 |
| Iroquois | 0.4 /100 | #272 | Tragic $42,430 |
| Immigrants | Dominica | 0.4 /100 | #273 | Tragic $42,420 |