Greek vs Immigrants from Laos Female Poverty
COMPARE
Greek
Immigrants from Laos
Female Poverty
Female Poverty Comparison
Greeks
Immigrants from Laos
11.7%
FEMALE POVERTY
99.5/ 100
METRIC RATING
30th/ 347
METRIC RANK
15.0%
FEMALE POVERTY
0.9/ 100
METRIC RATING
235th/ 347
METRIC RANK
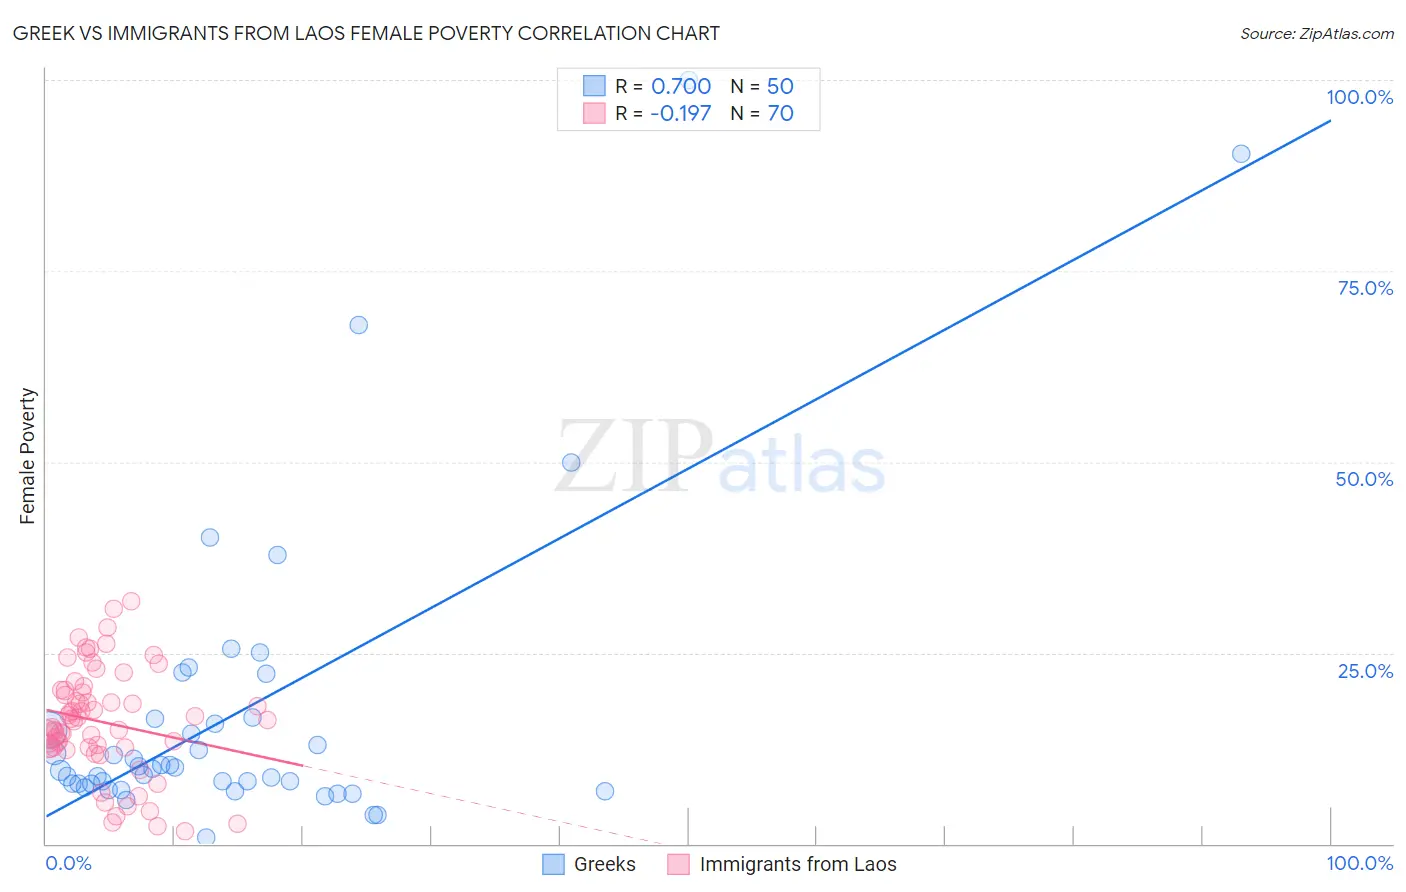
Greek vs Immigrants from Laos Female Poverty Correlation Chart
The statistical analysis conducted on geographies consisting of 482,170,203 people shows a significant positive correlation between the proportion of Greeks and poverty level among females in the United States with a correlation coefficient (R) of 0.700 and weighted average of 11.7%. Similarly, the statistical analysis conducted on geographies consisting of 201,464,148 people shows a poor negative correlation between the proportion of Immigrants from Laos and poverty level among females in the United States with a correlation coefficient (R) of -0.197 and weighted average of 15.0%, a difference of 27.8%.
Female Poverty Correlation Summary
| Measurement | Greek | Immigrants from Laos |
| Minimum | 0.85% | 1.6% |
| Maximum | 100.0% | 31.7% |
| Range | 99.2% | 30.1% |
| Mean | 17.3% | 15.9% |
| Median | 9.9% | 16.1% |
| Interquartile 25% (IQ1) | 7.9% | 12.6% |
| Interquartile 75% (IQ3) | 16.3% | 20.1% |
| Interquartile Range (IQR) | 8.5% | 7.5% |
| Standard Deviation (Sample) | 20.2% | 7.0% |
| Standard Deviation (Population) | 20.0% | 6.9% |
Similar Demographics by Female Poverty
Demographics Similar to Greeks by Female Poverty
In terms of female poverty, the demographic groups most similar to Greeks are Immigrants from North Macedonia (11.7%, a difference of 0.080%), Polish (11.7%, a difference of 0.22%), Immigrants from Korea (11.7%, a difference of 0.23%), Danish (11.7%, a difference of 0.35%), and Cypriot (11.8%, a difference of 0.42%).
| Demographics | Rating | Rank | Female Poverty |
| Burmese | 99.7 /100 | #23 | Exceptional 11.6% |
| Luxembourgers | 99.7 /100 | #24 | Exceptional 11.6% |
| Immigrants | Northern Europe | 99.6 /100 | #25 | Exceptional 11.6% |
| Croatians | 99.6 /100 | #26 | Exceptional 11.6% |
| Iranians | 99.6 /100 | #27 | Exceptional 11.7% |
| Immigrants | Korea | 99.6 /100 | #28 | Exceptional 11.7% |
| Immigrants | North Macedonia | 99.6 /100 | #29 | Exceptional 11.7% |
| Greeks | 99.5 /100 | #30 | Exceptional 11.7% |
| Poles | 99.5 /100 | #31 | Exceptional 11.7% |
| Danes | 99.5 /100 | #32 | Exceptional 11.7% |
| Cypriots | 99.5 /100 | #33 | Exceptional 11.8% |
| Immigrants | Singapore | 99.4 /100 | #34 | Exceptional 11.8% |
| Immigrants | Iran | 99.4 /100 | #35 | Exceptional 11.8% |
| Immigrants | Pakistan | 99.4 /100 | #36 | Exceptional 11.8% |
| Immigrants | Greece | 99.3 /100 | #37 | Exceptional 11.8% |
Demographics Similar to Immigrants from Laos by Female Poverty
In terms of female poverty, the demographic groups most similar to Immigrants from Laos are Fijian (14.9%, a difference of 0.44%), Cree (15.1%, a difference of 0.63%), French American Indian (15.1%, a difference of 0.82%), Immigrants from Armenia (15.1%, a difference of 0.90%), and Immigrants from Saudi Arabia (14.8%, a difference of 0.96%).
| Demographics | Rating | Rank | Female Poverty |
| German Russians | 2.0 /100 | #228 | Tragic 14.7% |
| Ghanaians | 1.9 /100 | #229 | Tragic 14.7% |
| Alaska Natives | 1.8 /100 | #230 | Tragic 14.7% |
| Nigerians | 1.7 /100 | #231 | Tragic 14.8% |
| Osage | 1.5 /100 | #232 | Tragic 14.8% |
| Immigrants | Saudi Arabia | 1.4 /100 | #233 | Tragic 14.8% |
| Fijians | 1.1 /100 | #234 | Tragic 14.9% |
| Immigrants | Laos | 0.9 /100 | #235 | Tragic 15.0% |
| Cree | 0.7 /100 | #236 | Tragic 15.1% |
| French American Indians | 0.6 /100 | #237 | Tragic 15.1% |
| Immigrants | Armenia | 0.6 /100 | #238 | Tragic 15.1% |
| Immigrants | Middle Africa | 0.5 /100 | #239 | Tragic 15.2% |
| Sudanese | 0.5 /100 | #240 | Tragic 15.2% |
| Immigrants | Sudan | 0.4 /100 | #241 | Tragic 15.2% |
| Nepalese | 0.4 /100 | #242 | Tragic 15.2% |