Immigrants from Taiwan vs Immigrants from Laos Disability Age Under 5
COMPARE
Immigrants from Taiwan
Immigrants from Laos
Disability Age Under 5
Disability Age Under 5 Comparison
Immigrants from Taiwan
Immigrants from Laos
1.0%
DISABILITY AGE UNDER 5
100.0/ 100
METRIC RATING
26th/ 347
METRIC RANK
1.3%
DISABILITY AGE UNDER 5
36.6/ 100
METRIC RATING
190th/ 347
METRIC RANK
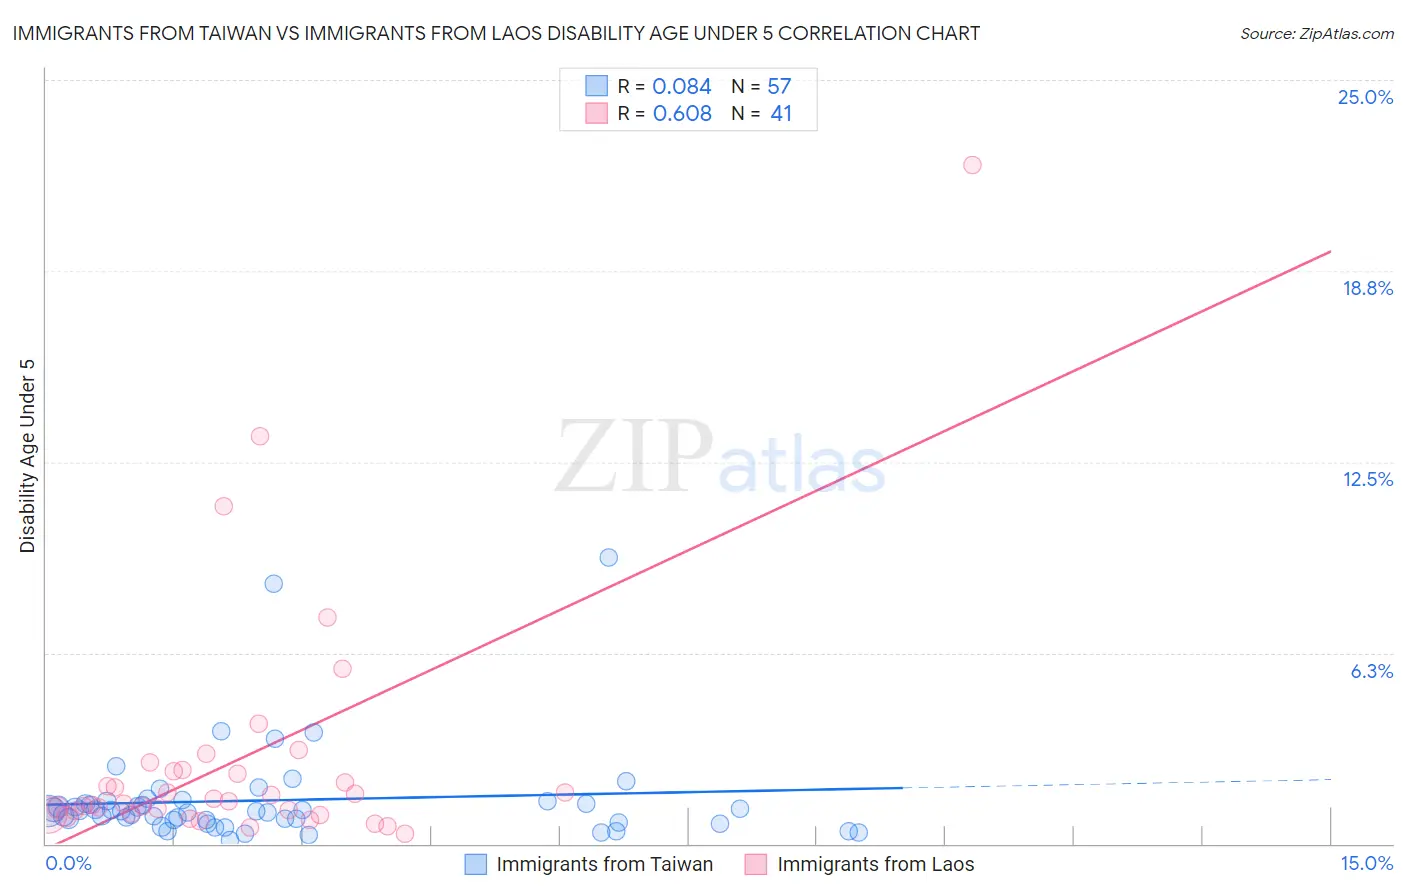
Immigrants from Taiwan vs Immigrants from Laos Disability Age Under 5 Correlation Chart
The statistical analysis conducted on geographies consisting of 173,979,803 people shows a slight positive correlation between the proportion of Immigrants from Taiwan and percentage of population with a disability under the age of 5 in the United States with a correlation coefficient (R) of 0.084 and weighted average of 1.0%. Similarly, the statistical analysis conducted on geographies consisting of 136,282,116 people shows a significant positive correlation between the proportion of Immigrants from Laos and percentage of population with a disability under the age of 5 in the United States with a correlation coefficient (R) of 0.608 and weighted average of 1.3%, a difference of 24.7%.
Disability Age Under 5 Correlation Summary
| Measurement | Immigrants from Taiwan | Immigrants from Laos |
| Minimum | 0.13% | 0.33% |
| Maximum | 9.4% | 22.2% |
| Range | 9.2% | 21.9% |
| Mean | 1.4% | 2.8% |
| Median | 1.1% | 1.4% |
| Interquartile 25% (IQ1) | 0.73% | 0.97% |
| Interquartile 75% (IQ3) | 1.4% | 2.4% |
| Interquartile Range (IQR) | 0.63% | 1.4% |
| Standard Deviation (Sample) | 1.6% | 4.1% |
| Standard Deviation (Population) | 1.6% | 4.0% |
Similar Demographics by Disability Age Under 5
Demographics Similar to Immigrants from Taiwan by Disability Age Under 5
In terms of disability age under 5, the demographic groups most similar to Immigrants from Taiwan are Immigrants from Micronesia (1.0%, a difference of 0.12%), Indian (Asian) (1.0%, a difference of 0.43%), Yakama (1.00%, a difference of 0.72%), Immigrants from Iran (1.00%, a difference of 0.79%), and Guyanese (1.0%, a difference of 0.84%).
| Demographics | Rating | Rank | Disability Age Under 5 |
| Puget Sound Salish | 100.0 /100 | #19 | Exceptional 0.97% |
| Nepalese | 100.0 /100 | #20 | Exceptional 0.97% |
| British West Indians | 100.0 /100 | #21 | Exceptional 0.99% |
| Immigrants | Iran | 100.0 /100 | #22 | Exceptional 1.00% |
| Yakama | 100.0 /100 | #23 | Exceptional 1.00% |
| Indians (Asian) | 100.0 /100 | #24 | Exceptional 1.0% |
| Immigrants | Micronesia | 100.0 /100 | #25 | Exceptional 1.0% |
| Immigrants | Taiwan | 100.0 /100 | #26 | Exceptional 1.0% |
| Guyanese | 100.0 /100 | #27 | Exceptional 1.0% |
| Immigrants | Eastern Asia | 100.0 /100 | #28 | Exceptional 1.0% |
| Immigrants | Belarus | 100.0 /100 | #29 | Exceptional 1.0% |
| Immigrants | South Central Asia | 99.9 /100 | #30 | Exceptional 1.0% |
| Armenians | 99.9 /100 | #31 | Exceptional 1.0% |
| Iranians | 99.9 /100 | #32 | Exceptional 1.0% |
| Bolivians | 99.9 /100 | #33 | Exceptional 1.0% |
Demographics Similar to Immigrants from Laos by Disability Age Under 5
In terms of disability age under 5, the demographic groups most similar to Immigrants from Laos are Mexican American Indian (1.3%, a difference of 0.010%), Immigrants from Bosnia and Herzegovina (1.3%, a difference of 0.010%), Immigrants from Sierra Leone (1.3%, a difference of 0.010%), Peruvian (1.3%, a difference of 0.090%), and Immigrants from North Macedonia (1.3%, a difference of 0.19%).
| Demographics | Rating | Rank | Disability Age Under 5 |
| Immigrants | Saudi Arabia | 43.3 /100 | #183 | Average 1.2% |
| Palestinians | 43.0 /100 | #184 | Average 1.2% |
| Immigrants | Western Africa | 42.5 /100 | #185 | Average 1.2% |
| Cubans | 42.5 /100 | #186 | Average 1.2% |
| Immigrants | Haiti | 40.2 /100 | #187 | Average 1.3% |
| Haitians | 39.9 /100 | #188 | Fair 1.3% |
| Peruvians | 37.6 /100 | #189 | Fair 1.3% |
| Immigrants | Laos | 36.6 /100 | #190 | Fair 1.3% |
| Mexican American Indians | 36.6 /100 | #191 | Fair 1.3% |
| Immigrants | Bosnia and Herzegovina | 36.5 /100 | #192 | Fair 1.3% |
| Immigrants | Sierra Leone | 36.5 /100 | #193 | Fair 1.3% |
| Immigrants | North Macedonia | 34.7 /100 | #194 | Fair 1.3% |
| U.S. Virgin Islanders | 34.4 /100 | #195 | Fair 1.3% |
| Immigrants | Belgium | 31.4 /100 | #196 | Fair 1.3% |
| Immigrants | Somalia | 31.3 /100 | #197 | Fair 1.3% |