Greek vs Immigrants from Middle Africa Disability Age Under 5
COMPARE
Greek
Immigrants from Middle Africa
Disability Age Under 5
Disability Age Under 5 Comparison
Greeks
Immigrants from Middle Africa
1.5%
DISABILITY AGE UNDER 5
0.0/ 100
METRIC RATING
276th/ 347
METRIC RANK
1.2%
DISABILITY AGE UNDER 5
79.3/ 100
METRIC RATING
144th/ 347
METRIC RANK
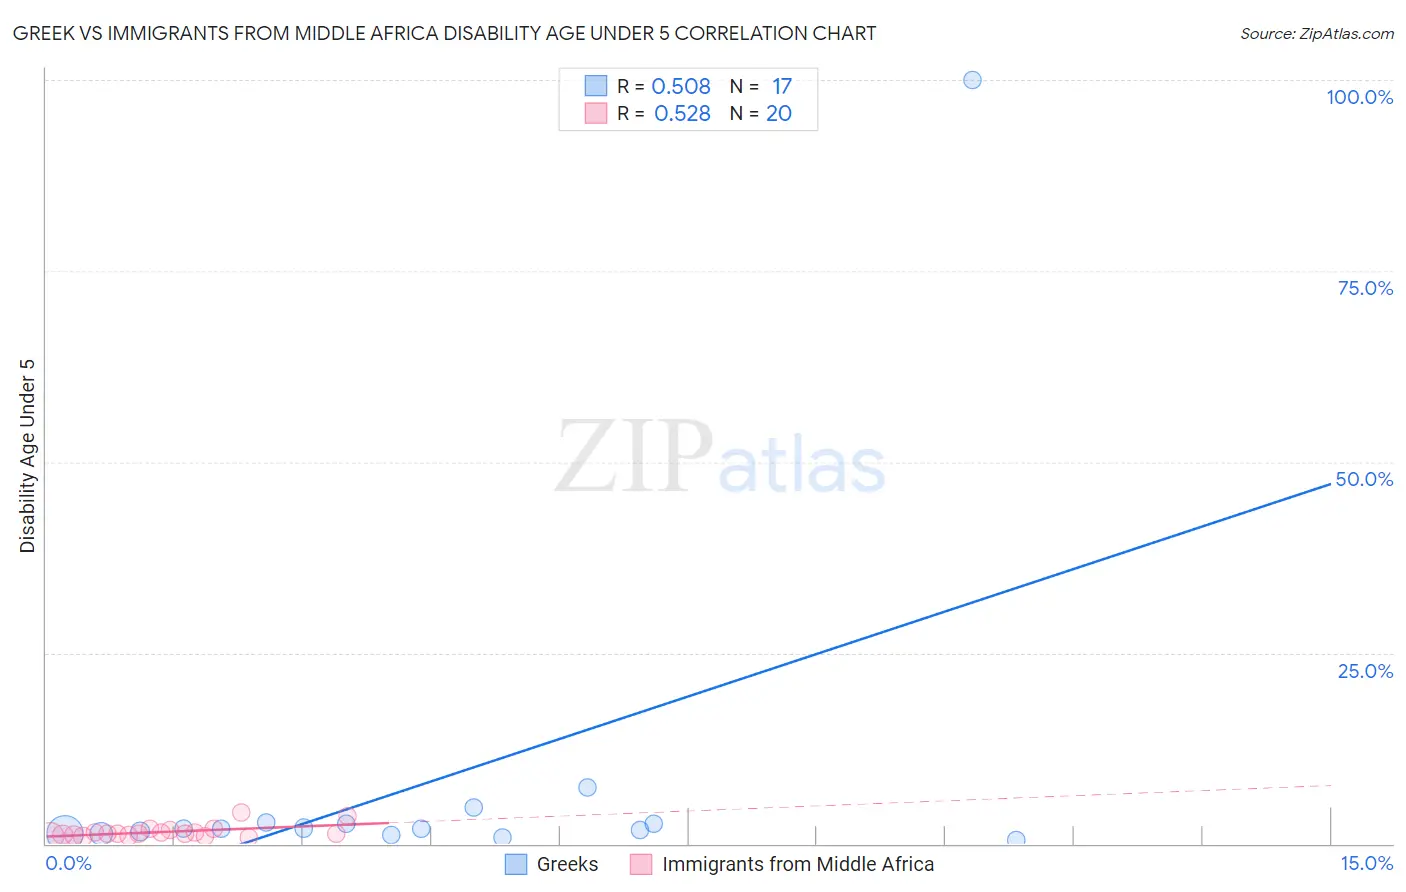
Greek vs Immigrants from Middle Africa Disability Age Under 5 Correlation Chart
The statistical analysis conducted on geographies consisting of 239,993,794 people shows a substantial positive correlation between the proportion of Greeks and percentage of population with a disability under the age of 5 in the United States with a correlation coefficient (R) of 0.508 and weighted average of 1.5%. Similarly, the statistical analysis conducted on geographies consisting of 135,378,258 people shows a substantial positive correlation between the proportion of Immigrants from Middle Africa and percentage of population with a disability under the age of 5 in the United States with a correlation coefficient (R) of 0.528 and weighted average of 1.2%, a difference of 21.8%.
Disability Age Under 5 Correlation Summary
| Measurement | Greek | Immigrants from Middle Africa |
| Minimum | 0.57% | 0.88% |
| Maximum | 100.0% | 4.0% |
| Range | 99.4% | 3.1% |
| Mean | 8.0% | 1.6% |
| Median | 2.0% | 1.3% |
| Interquartile 25% (IQ1) | 1.3% | 1.1% |
| Interquartile 75% (IQ3) | 2.7% | 1.6% |
| Interquartile Range (IQR) | 1.4% | 0.53% |
| Standard Deviation (Sample) | 23.8% | 0.82% |
| Standard Deviation (Population) | 23.0% | 0.80% |
Similar Demographics by Disability Age Under 5
Demographics Similar to Greeks by Disability Age Under 5
In terms of disability age under 5, the demographic groups most similar to Greeks are Brazilian (1.5%, a difference of 0.57%), Iroquois (1.5%, a difference of 0.69%), Canadian (1.5%, a difference of 0.70%), Kiowa (1.5%, a difference of 0.78%), and Danish (1.5%, a difference of 0.79%).
| Demographics | Rating | Rank | Disability Age Under 5 |
| Austrians | 0.1 /100 | #269 | Tragic 1.4% |
| Immigrants | North America | 0.1 /100 | #270 | Tragic 1.4% |
| Immigrants | Canada | 0.1 /100 | #271 | Tragic 1.4% |
| Blacks/African Americans | 0.1 /100 | #272 | Tragic 1.4% |
| Alaskan Athabascans | 0.1 /100 | #273 | Tragic 1.5% |
| Iroquois | 0.0 /100 | #274 | Tragic 1.5% |
| Brazilians | 0.0 /100 | #275 | Tragic 1.5% |
| Greeks | 0.0 /100 | #276 | Tragic 1.5% |
| Canadians | 0.0 /100 | #277 | Tragic 1.5% |
| Kiowa | 0.0 /100 | #278 | Tragic 1.5% |
| Danes | 0.0 /100 | #279 | Tragic 1.5% |
| British | 0.0 /100 | #280 | Tragic 1.5% |
| Czechoslovakians | 0.0 /100 | #281 | Tragic 1.5% |
| Cheyenne | 0.0 /100 | #282 | Tragic 1.5% |
| Delaware | 0.0 /100 | #283 | Tragic 1.5% |
Demographics Similar to Immigrants from Middle Africa by Disability Age Under 5
In terms of disability age under 5, the demographic groups most similar to Immigrants from Middle Africa are Alsatian (1.2%, a difference of 0.0%), Immigrants from Colombia (1.2%, a difference of 0.010%), Immigrants from Honduras (1.2%, a difference of 0.16%), Immigrants from Zimbabwe (1.2%, a difference of 0.18%), and Somali (1.2%, a difference of 0.22%).
| Demographics | Rating | Rank | Disability Age Under 5 |
| Immigrants | Eastern Africa | 83.1 /100 | #137 | Excellent 1.2% |
| Immigrants | Czechoslovakia | 82.8 /100 | #138 | Excellent 1.2% |
| New Zealanders | 81.4 /100 | #139 | Excellent 1.2% |
| Somalis | 80.8 /100 | #140 | Excellent 1.2% |
| Immigrants | Honduras | 80.4 /100 | #141 | Excellent 1.2% |
| Immigrants | Colombia | 79.3 /100 | #142 | Good 1.2% |
| Alsatians | 79.3 /100 | #143 | Good 1.2% |
| Immigrants | Middle Africa | 79.3 /100 | #144 | Good 1.2% |
| Immigrants | Zimbabwe | 77.9 /100 | #145 | Good 1.2% |
| Samoans | 77.7 /100 | #146 | Good 1.2% |
| Icelanders | 76.3 /100 | #147 | Good 1.2% |
| Ghanaians | 76.3 /100 | #148 | Good 1.2% |
| Kenyans | 75.9 /100 | #149 | Good 1.2% |
| South Americans | 75.6 /100 | #150 | Good 1.2% |
| Yaqui | 74.8 /100 | #151 | Good 1.2% |