Bulgarian vs Immigrants from Laos Disability Age Under 5
COMPARE
Bulgarian
Immigrants from Laos
Disability Age Under 5
Disability Age Under 5 Comparison
Bulgarians
Immigrants from Laos
1.3%
DISABILITY AGE UNDER 5
19.5/ 100
METRIC RATING
209th/ 347
METRIC RANK
1.3%
DISABILITY AGE UNDER 5
36.6/ 100
METRIC RATING
190th/ 347
METRIC RANK
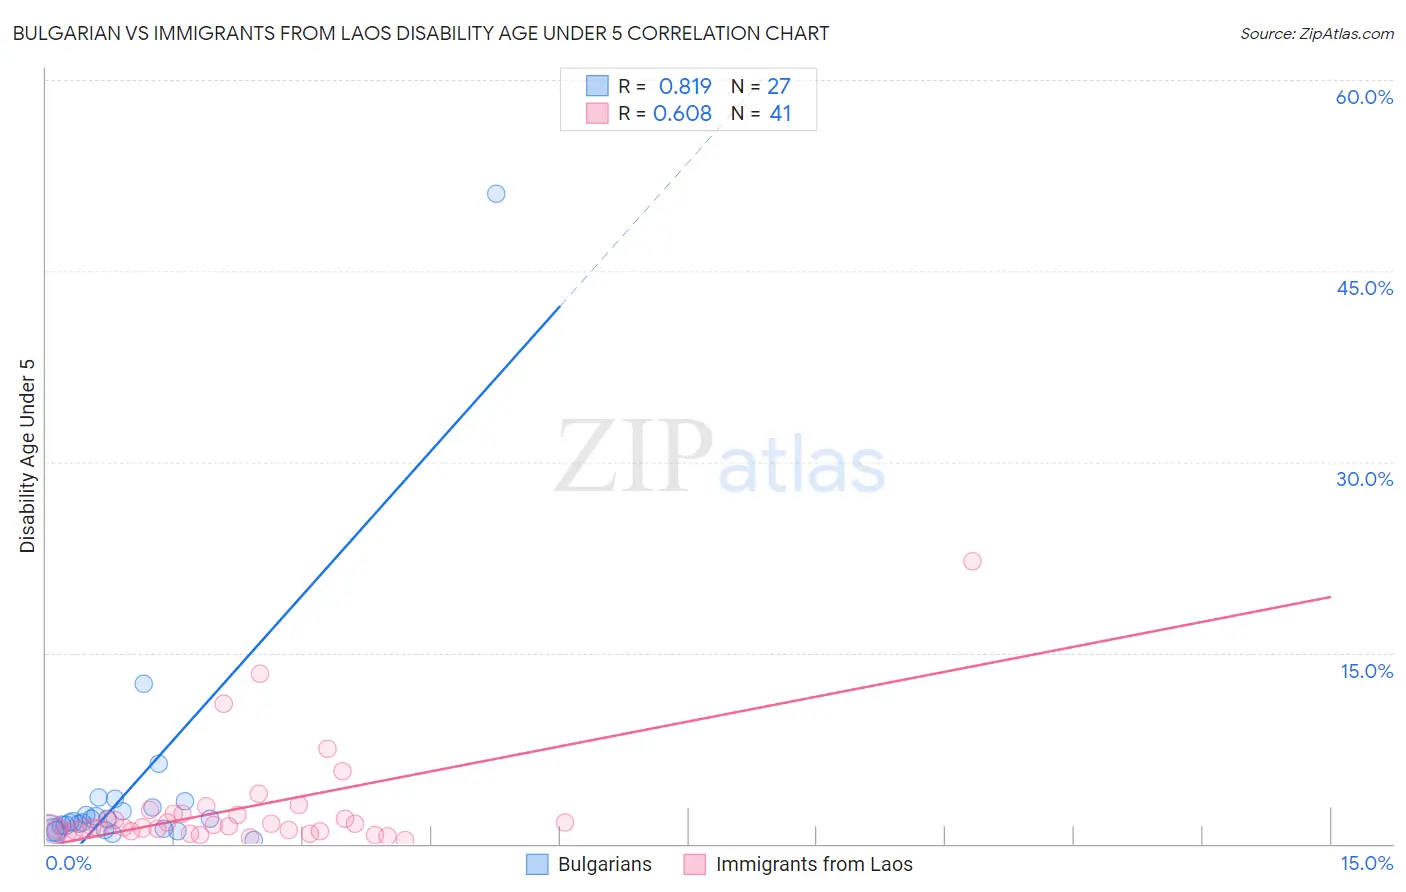
Bulgarian vs Immigrants from Laos Disability Age Under 5 Correlation Chart
The statistical analysis conducted on geographies consisting of 131,414,932 people shows a very strong positive correlation between the proportion of Bulgarians and percentage of population with a disability under the age of 5 in the United States with a correlation coefficient (R) of 0.819 and weighted average of 1.3%. Similarly, the statistical analysis conducted on geographies consisting of 136,282,116 people shows a significant positive correlation between the proportion of Immigrants from Laos and percentage of population with a disability under the age of 5 in the United States with a correlation coefficient (R) of 0.608 and weighted average of 1.3%, a difference of 1.9%.
Disability Age Under 5 Correlation Summary
| Measurement | Bulgarian | Immigrants from Laos |
| Minimum | 0.31% | 0.33% |
| Maximum | 51.1% | 22.2% |
| Range | 50.8% | 21.9% |
| Mean | 4.2% | 2.8% |
| Median | 1.7% | 1.4% |
| Interquartile 25% (IQ1) | 1.1% | 0.97% |
| Interquartile 75% (IQ3) | 2.8% | 2.4% |
| Interquartile Range (IQR) | 1.7% | 1.4% |
| Standard Deviation (Sample) | 9.7% | 4.1% |
| Standard Deviation (Population) | 9.5% | 4.0% |
Demographics Similar to Bulgarians and Immigrants from Laos by Disability Age Under 5
In terms of disability age under 5, the demographic groups most similar to Bulgarians are Mexican (1.3%, a difference of 0.18%), Nigerian (1.3%, a difference of 0.23%), Immigrants from Poland (1.3%, a difference of 0.39%), Romanian (1.3%, a difference of 0.41%), and Immigrants from Europe (1.3%, a difference of 0.54%). Similarly, the demographic groups most similar to Immigrants from Laos are Mexican American Indian (1.3%, a difference of 0.010%), Immigrants from Bosnia and Herzegovina (1.3%, a difference of 0.010%), Immigrants from Sierra Leone (1.3%, a difference of 0.010%), Peruvian (1.3%, a difference of 0.090%), and Immigrants from North Macedonia (1.3%, a difference of 0.19%).
| Demographics | Rating | Rank | Disability Age Under 5 |
| Peruvians | 37.6 /100 | #189 | Fair 1.3% |
| Immigrants | Laos | 36.6 /100 | #190 | Fair 1.3% |
| Mexican American Indians | 36.6 /100 | #191 | Fair 1.3% |
| Immigrants | Bosnia and Herzegovina | 36.5 /100 | #192 | Fair 1.3% |
| Immigrants | Sierra Leone | 36.5 /100 | #193 | Fair 1.3% |
| Immigrants | North Macedonia | 34.7 /100 | #194 | Fair 1.3% |
| U.S. Virgin Islanders | 34.4 /100 | #195 | Fair 1.3% |
| Immigrants | Belgium | 31.4 /100 | #196 | Fair 1.3% |
| Immigrants | Somalia | 31.3 /100 | #197 | Fair 1.3% |
| Immigrants | Norway | 31.1 /100 | #198 | Fair 1.3% |
| Jamaicans | 30.7 /100 | #199 | Fair 1.3% |
| Immigrants | Lithuania | 27.2 /100 | #200 | Fair 1.3% |
| Immigrants | Italy | 25.4 /100 | #201 | Fair 1.3% |
| Arapaho | 24.1 /100 | #202 | Fair 1.3% |
| Liberians | 24.0 /100 | #203 | Fair 1.3% |
| Immigrants | Europe | 23.6 /100 | #204 | Fair 1.3% |
| Romanians | 22.5 /100 | #205 | Fair 1.3% |
| Immigrants | Poland | 22.4 /100 | #206 | Fair 1.3% |
| Nigerians | 21.2 /100 | #207 | Fair 1.3% |
| Mexicans | 20.8 /100 | #208 | Fair 1.3% |
| Bulgarians | 19.5 /100 | #209 | Poor 1.3% |