German vs Osage Disability Age 5 to 17
COMPARE
German
Osage
Disability Age 5 to 17
Disability Age 5 to 17 Comparison
Germans
Osage
6.1%
DISABILITY AGE 5 TO 17
0.0/ 100
METRIC RATING
282nd/ 347
METRIC RANK
6.5%
DISABILITY AGE 5 TO 17
0.0/ 100
METRIC RATING
323rd/ 347
METRIC RANK
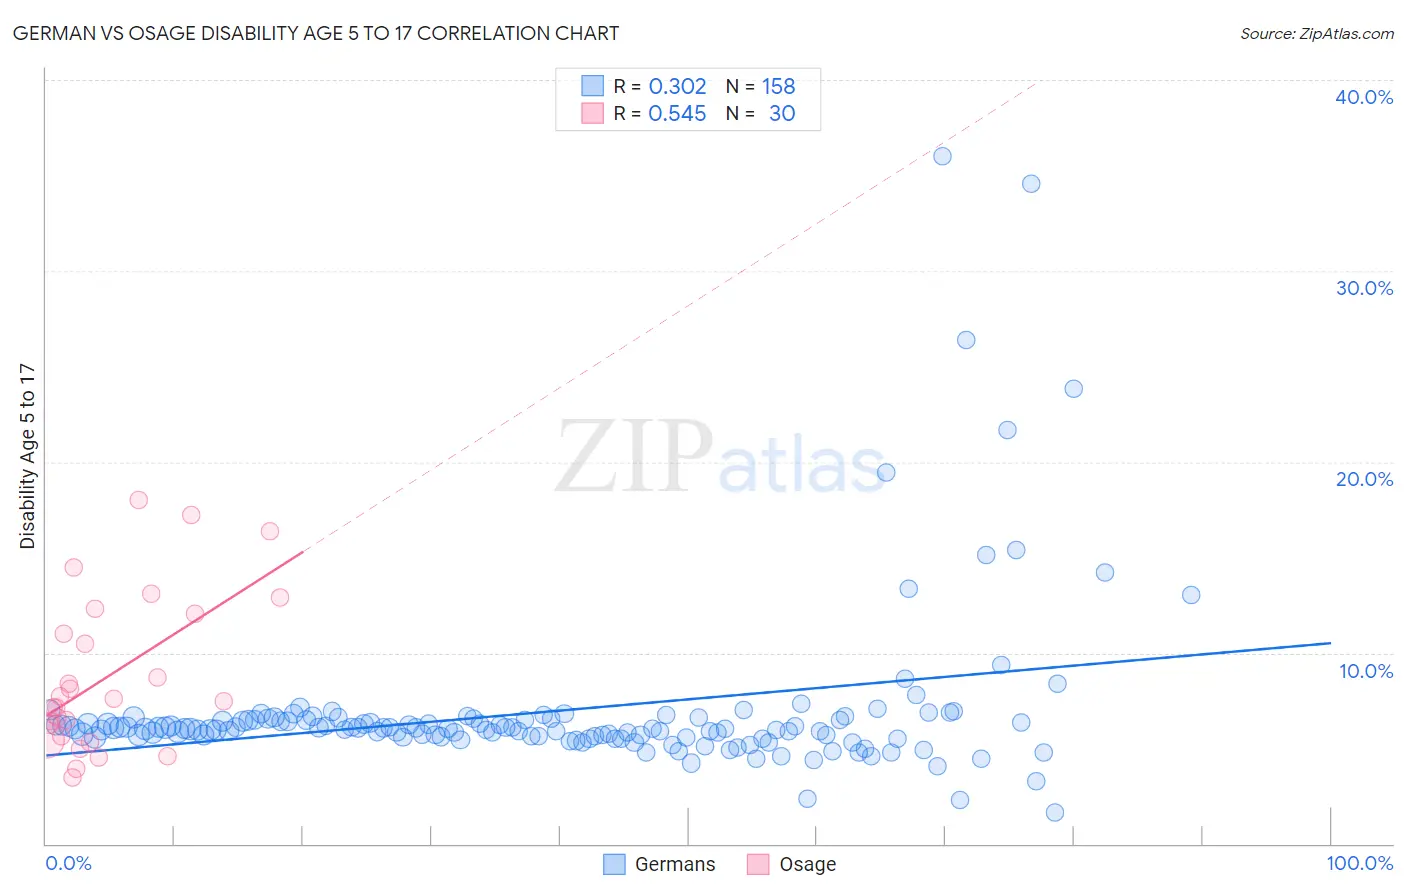
German vs Osage Disability Age 5 to 17 Correlation Chart
The statistical analysis conducted on geographies consisting of 564,502,598 people shows a mild positive correlation between the proportion of Germans and percentage of population with a disability between the ages 5 and 17 in the United States with a correlation coefficient (R) of 0.302 and weighted average of 6.1%. Similarly, the statistical analysis conducted on geographies consisting of 91,613,344 people shows a substantial positive correlation between the proportion of Osage and percentage of population with a disability between the ages 5 and 17 in the United States with a correlation coefficient (R) of 0.545 and weighted average of 6.5%, a difference of 6.0%.
Disability Age 5 to 17 Correlation Summary
| Measurement | German | Osage |
| Minimum | 1.7% | 3.5% |
| Maximum | 36.0% | 18.0% |
| Range | 34.3% | 14.5% |
| Mean | 7.0% | 8.8% |
| Median | 6.0% | 7.5% |
| Interquartile 25% (IQ1) | 5.6% | 5.7% |
| Interquartile 75% (IQ3) | 6.5% | 12.0% |
| Interquartile Range (IQR) | 0.88% | 6.4% |
| Standard Deviation (Sample) | 4.5% | 4.1% |
| Standard Deviation (Population) | 4.5% | 4.0% |
Similar Demographics by Disability Age 5 to 17
Demographics Similar to Germans by Disability Age 5 to 17
In terms of disability age 5 to 17, the demographic groups most similar to Germans are Ugandan (6.2%, a difference of 0.16%), Subsaharan African (6.2%, a difference of 0.19%), English (6.2%, a difference of 0.19%), Colville (6.2%, a difference of 0.23%), and Scottish (6.1%, a difference of 0.25%).
| Demographics | Rating | Rank | Disability Age 5 to 17 |
| Dutch | 0.2 /100 | #275 | Tragic 6.0% |
| Japanese | 0.1 /100 | #276 | Tragic 6.1% |
| Puget Sound Salish | 0.1 /100 | #277 | Tragic 6.1% |
| Immigrants | Liberia | 0.1 /100 | #278 | Tragic 6.1% |
| Immigrants | Jamaica | 0.1 /100 | #279 | Tragic 6.1% |
| Portuguese | 0.1 /100 | #280 | Tragic 6.1% |
| Scottish | 0.0 /100 | #281 | Tragic 6.1% |
| Germans | 0.0 /100 | #282 | Tragic 6.1% |
| Ugandans | 0.0 /100 | #283 | Tragic 6.2% |
| Sub-Saharan Africans | 0.0 /100 | #284 | Tragic 6.2% |
| English | 0.0 /100 | #285 | Tragic 6.2% |
| Colville | 0.0 /100 | #286 | Tragic 6.2% |
| Pima | 0.0 /100 | #287 | Tragic 6.2% |
| Jamaicans | 0.0 /100 | #288 | Tragic 6.2% |
| Yaqui | 0.0 /100 | #289 | Tragic 6.2% |
Demographics Similar to Osage by Disability Age 5 to 17
In terms of disability age 5 to 17, the demographic groups most similar to Osage are Slovak (6.5%, a difference of 0.040%), Tohono O'odham (6.5%, a difference of 0.060%), Dominican (6.5%, a difference of 0.080%), American (6.5%, a difference of 0.14%), and Potawatomi (6.5%, a difference of 0.27%).
| Demographics | Rating | Rank | Disability Age 5 to 17 |
| Immigrants | Dominican Republic | 0.0 /100 | #316 | Tragic 6.4% |
| Kiowa | 0.0 /100 | #317 | Tragic 6.4% |
| Comanche | 0.0 /100 | #318 | Tragic 6.4% |
| Delaware | 0.0 /100 | #319 | Tragic 6.5% |
| Africans | 0.0 /100 | #320 | Tragic 6.5% |
| Tohono O'odham | 0.0 /100 | #321 | Tragic 6.5% |
| Slovaks | 0.0 /100 | #322 | Tragic 6.5% |
| Osage | 0.0 /100 | #323 | Tragic 6.5% |
| Dominicans | 0.0 /100 | #324 | Tragic 6.5% |
| Americans | 0.0 /100 | #325 | Tragic 6.5% |
| Potawatomi | 0.0 /100 | #326 | Tragic 6.5% |
| French American Indians | 0.0 /100 | #327 | Tragic 6.6% |
| Pennsylvania Germans | 0.0 /100 | #328 | Tragic 6.6% |
| Blackfeet | 0.0 /100 | #329 | Tragic 6.6% |
| Dutch West Indians | 0.0 /100 | #330 | Tragic 6.7% |