German vs Maltese Disability Age 5 to 17
COMPARE
German
Maltese
Disability Age 5 to 17
Disability Age 5 to 17 Comparison
Germans
Maltese
6.1%
DISABILITY AGE 5 TO 17
0.0/ 100
METRIC RATING
282nd/ 347
METRIC RANK
5.4%
DISABILITY AGE 5 TO 17
96.0/ 100
METRIC RATING
121st/ 347
METRIC RANK
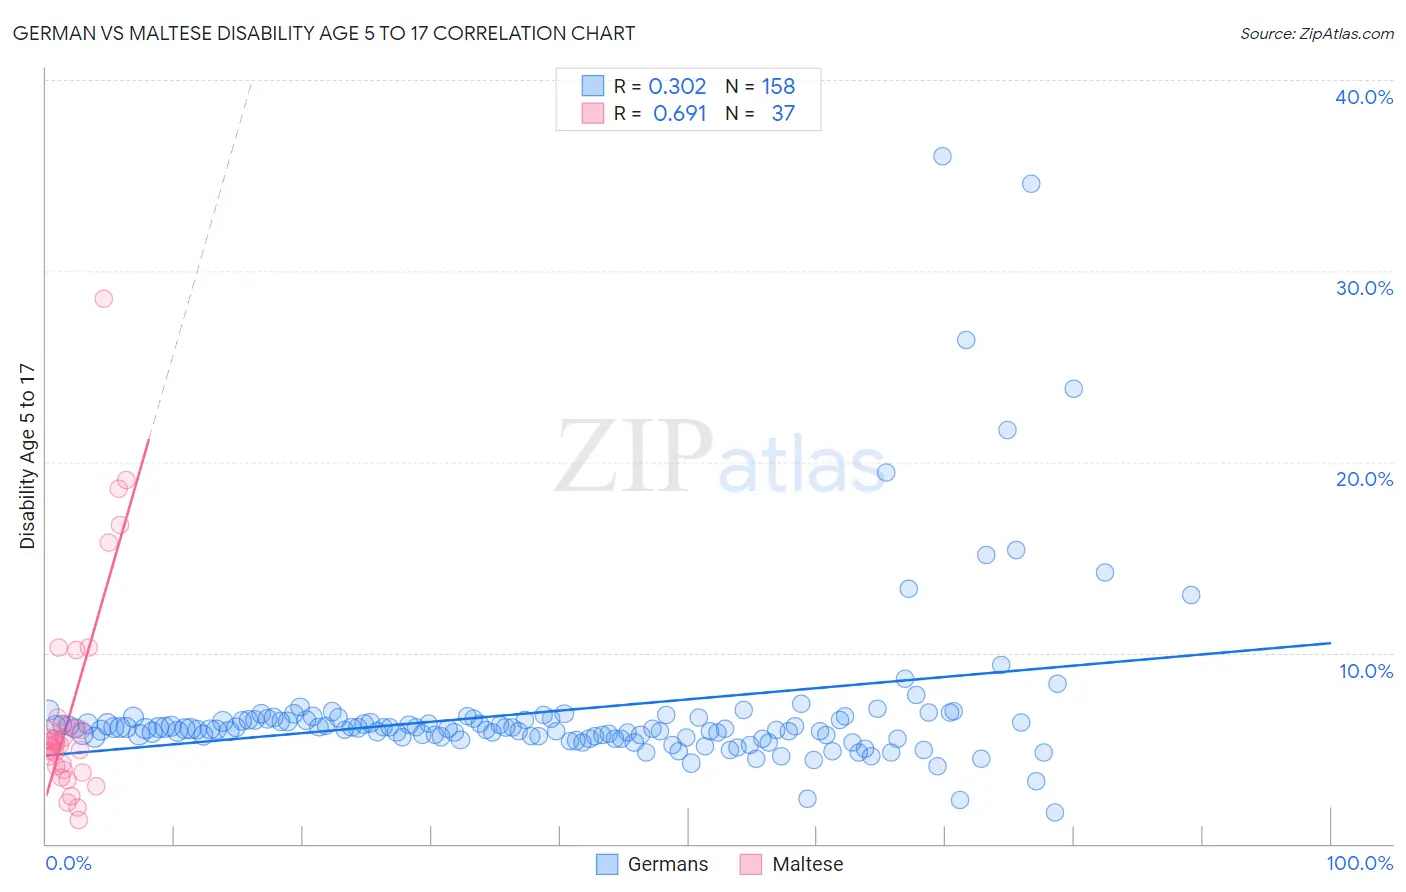
German vs Maltese Disability Age 5 to 17 Correlation Chart
The statistical analysis conducted on geographies consisting of 564,502,598 people shows a mild positive correlation between the proportion of Germans and percentage of population with a disability between the ages 5 and 17 in the United States with a correlation coefficient (R) of 0.302 and weighted average of 6.1%. Similarly, the statistical analysis conducted on geographies consisting of 125,822,191 people shows a significant positive correlation between the proportion of Maltese and percentage of population with a disability between the ages 5 and 17 in the United States with a correlation coefficient (R) of 0.691 and weighted average of 5.4%, a difference of 14.3%.
Disability Age 5 to 17 Correlation Summary
| Measurement | German | Maltese |
| Minimum | 1.7% | 1.3% |
| Maximum | 36.0% | 28.6% |
| Range | 34.3% | 27.3% |
| Mean | 7.0% | 7.0% |
| Median | 6.0% | 5.2% |
| Interquartile 25% (IQ1) | 5.6% | 4.0% |
| Interquartile 75% (IQ3) | 6.5% | 6.4% |
| Interquartile Range (IQR) | 0.88% | 2.5% |
| Standard Deviation (Sample) | 4.5% | 5.7% |
| Standard Deviation (Population) | 4.5% | 5.6% |
Similar Demographics by Disability Age 5 to 17
Demographics Similar to Germans by Disability Age 5 to 17
In terms of disability age 5 to 17, the demographic groups most similar to Germans are Ugandan (6.2%, a difference of 0.16%), Subsaharan African (6.2%, a difference of 0.19%), English (6.2%, a difference of 0.19%), Colville (6.2%, a difference of 0.23%), and Scottish (6.1%, a difference of 0.25%).
| Demographics | Rating | Rank | Disability Age 5 to 17 |
| Dutch | 0.2 /100 | #275 | Tragic 6.0% |
| Japanese | 0.1 /100 | #276 | Tragic 6.1% |
| Puget Sound Salish | 0.1 /100 | #277 | Tragic 6.1% |
| Immigrants | Liberia | 0.1 /100 | #278 | Tragic 6.1% |
| Immigrants | Jamaica | 0.1 /100 | #279 | Tragic 6.1% |
| Portuguese | 0.1 /100 | #280 | Tragic 6.1% |
| Scottish | 0.0 /100 | #281 | Tragic 6.1% |
| Germans | 0.0 /100 | #282 | Tragic 6.1% |
| Ugandans | 0.0 /100 | #283 | Tragic 6.2% |
| Sub-Saharan Africans | 0.0 /100 | #284 | Tragic 6.2% |
| English | 0.0 /100 | #285 | Tragic 6.2% |
| Colville | 0.0 /100 | #286 | Tragic 6.2% |
| Pima | 0.0 /100 | #287 | Tragic 6.2% |
| Jamaicans | 0.0 /100 | #288 | Tragic 6.2% |
| Yaqui | 0.0 /100 | #289 | Tragic 6.2% |
Demographics Similar to Maltese by Disability Age 5 to 17
In terms of disability age 5 to 17, the demographic groups most similar to Maltese are Chilean (5.4%, a difference of 0.060%), Immigrants from Ethiopia (5.4%, a difference of 0.16%), Crow (5.4%, a difference of 0.29%), Immigrants from Chile (5.4%, a difference of 0.30%), and New Zealander (5.4%, a difference of 0.31%).
| Demographics | Rating | Rank | Disability Age 5 to 17 |
| Immigrants | Northern Europe | 97.8 /100 | #114 | Exceptional 5.3% |
| Cubans | 97.8 /100 | #115 | Exceptional 5.3% |
| Cypriots | 97.7 /100 | #116 | Exceptional 5.3% |
| Immigrants | Afghanistan | 97.4 /100 | #117 | Exceptional 5.3% |
| South Americans | 97.1 /100 | #118 | Exceptional 5.4% |
| Immigrants | South America | 97.1 /100 | #119 | Exceptional 5.4% |
| Immigrants | Immigrants | 97.0 /100 | #120 | Exceptional 5.4% |
| Maltese | 96.0 /100 | #121 | Exceptional 5.4% |
| Chileans | 95.8 /100 | #122 | Exceptional 5.4% |
| Immigrants | Ethiopia | 95.5 /100 | #123 | Exceptional 5.4% |
| Crow | 95.0 /100 | #124 | Exceptional 5.4% |
| Immigrants | Chile | 95.0 /100 | #125 | Exceptional 5.4% |
| New Zealanders | 95.0 /100 | #126 | Exceptional 5.4% |
| Latvians | 95.0 /100 | #127 | Exceptional 5.4% |
| Immigrants | Venezuela | 94.5 /100 | #128 | Exceptional 5.4% |