German vs Swedish Disability Age 5 to 17
COMPARE
German
Swedish
Disability Age 5 to 17
Disability Age 5 to 17 Comparison
Germans
Swedes
6.1%
DISABILITY AGE 5 TO 17
0.0/ 100
METRIC RATING
282nd/ 347
METRIC RANK
5.8%
DISABILITY AGE 5 TO 17
8.1/ 100
METRIC RATING
215th/ 347
METRIC RANK
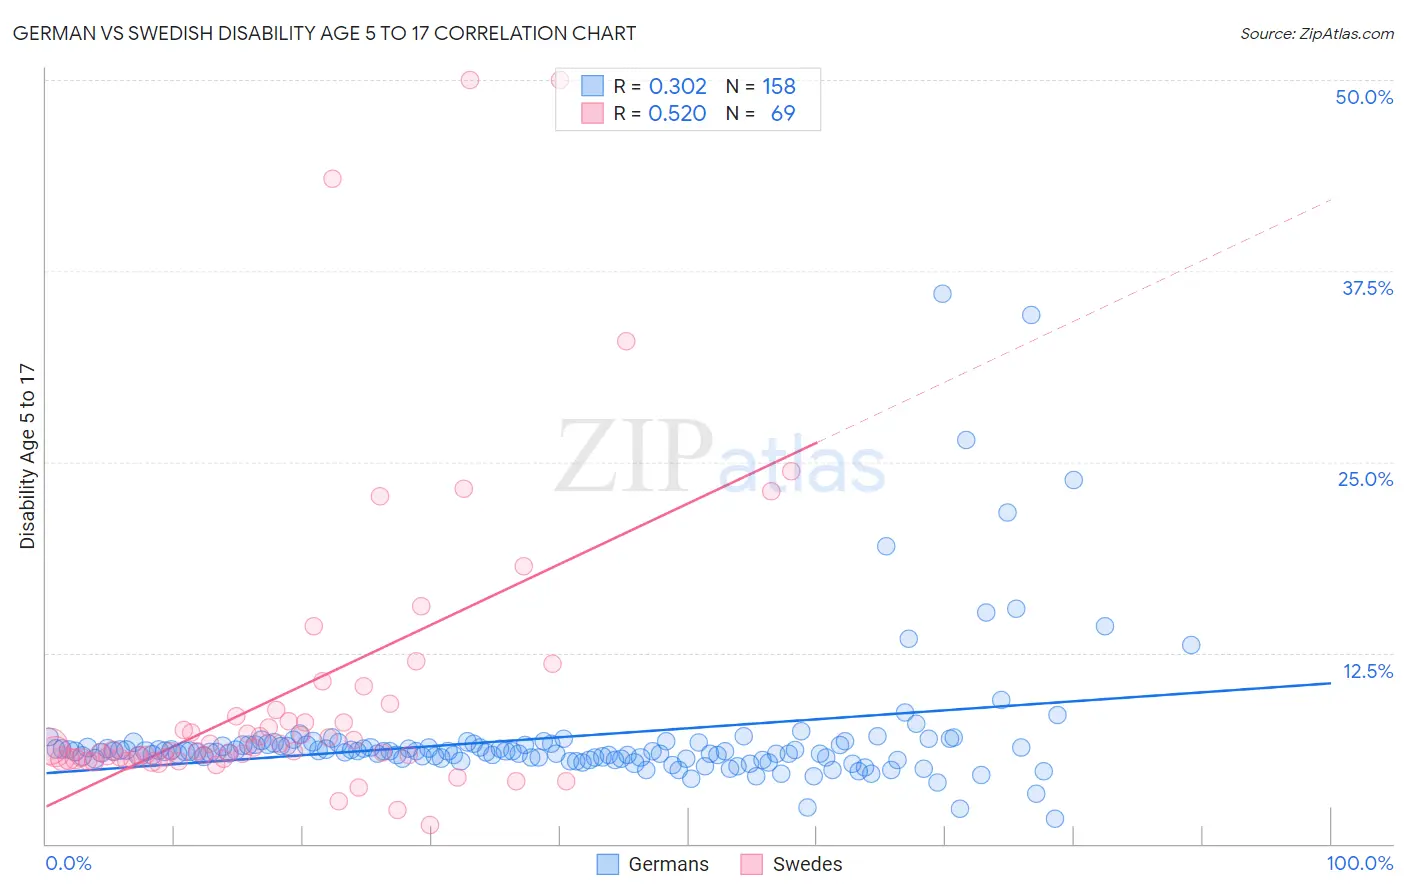
German vs Swedish Disability Age 5 to 17 Correlation Chart
The statistical analysis conducted on geographies consisting of 564,502,598 people shows a mild positive correlation between the proportion of Germans and percentage of population with a disability between the ages 5 and 17 in the United States with a correlation coefficient (R) of 0.302 and weighted average of 6.1%. Similarly, the statistical analysis conducted on geographies consisting of 528,112,319 people shows a substantial positive correlation between the proportion of Swedes and percentage of population with a disability between the ages 5 and 17 in the United States with a correlation coefficient (R) of 0.520 and weighted average of 5.8%, a difference of 6.6%.
Disability Age 5 to 17 Correlation Summary
| Measurement | German | Swedish |
| Minimum | 1.7% | 1.3% |
| Maximum | 36.0% | 50.0% |
| Range | 34.3% | 48.7% |
| Mean | 7.0% | 9.9% |
| Median | 6.0% | 6.1% |
| Interquartile 25% (IQ1) | 5.6% | 5.6% |
| Interquartile 75% (IQ3) | 6.5% | 8.5% |
| Interquartile Range (IQR) | 0.88% | 3.0% |
| Standard Deviation (Sample) | 4.5% | 9.9% |
| Standard Deviation (Population) | 4.5% | 9.8% |
Similar Demographics by Disability Age 5 to 17
Demographics Similar to Germans by Disability Age 5 to 17
In terms of disability age 5 to 17, the demographic groups most similar to Germans are Ugandan (6.2%, a difference of 0.16%), Subsaharan African (6.2%, a difference of 0.19%), English (6.2%, a difference of 0.19%), Colville (6.2%, a difference of 0.23%), and Scottish (6.1%, a difference of 0.25%).
| Demographics | Rating | Rank | Disability Age 5 to 17 |
| Dutch | 0.2 /100 | #275 | Tragic 6.0% |
| Japanese | 0.1 /100 | #276 | Tragic 6.1% |
| Puget Sound Salish | 0.1 /100 | #277 | Tragic 6.1% |
| Immigrants | Liberia | 0.1 /100 | #278 | Tragic 6.1% |
| Immigrants | Jamaica | 0.1 /100 | #279 | Tragic 6.1% |
| Portuguese | 0.1 /100 | #280 | Tragic 6.1% |
| Scottish | 0.0 /100 | #281 | Tragic 6.1% |
| Germans | 0.0 /100 | #282 | Tragic 6.1% |
| Ugandans | 0.0 /100 | #283 | Tragic 6.2% |
| Sub-Saharan Africans | 0.0 /100 | #284 | Tragic 6.2% |
| English | 0.0 /100 | #285 | Tragic 6.2% |
| Colville | 0.0 /100 | #286 | Tragic 6.2% |
| Pima | 0.0 /100 | #287 | Tragic 6.2% |
| Jamaicans | 0.0 /100 | #288 | Tragic 6.2% |
| Yaqui | 0.0 /100 | #289 | Tragic 6.2% |
Demographics Similar to Swedes by Disability Age 5 to 17
In terms of disability age 5 to 17, the demographic groups most similar to Swedes are Immigrants from Cameroon (5.8%, a difference of 0.040%), Immigrants from Morocco (5.8%, a difference of 0.040%), Immigrants from Panama (5.8%, a difference of 0.090%), Nigerian (5.8%, a difference of 0.090%), and Czech (5.8%, a difference of 0.12%).
| Demographics | Rating | Rank | Disability Age 5 to 17 |
| Kenyans | 10.0 /100 | #208 | Poor 5.8% |
| Immigrants | Uganda | 9.7 /100 | #209 | Tragic 5.8% |
| Immigrants | Haiti | 9.5 /100 | #210 | Tragic 5.8% |
| Yugoslavians | 9.1 /100 | #211 | Tragic 5.8% |
| Immigrants | Panama | 8.7 /100 | #212 | Tragic 5.8% |
| Immigrants | Cameroon | 8.3 /100 | #213 | Tragic 5.8% |
| Immigrants | Morocco | 8.3 /100 | #214 | Tragic 5.8% |
| Swedes | 8.1 /100 | #215 | Tragic 5.8% |
| Nigerians | 7.5 /100 | #216 | Tragic 5.8% |
| Czechs | 7.4 /100 | #217 | Tragic 5.8% |
| Immigrants | Sierra Leone | 7.1 /100 | #218 | Tragic 5.8% |
| Sierra Leoneans | 7.0 /100 | #219 | Tragic 5.8% |
| Belgians | 6.9 /100 | #220 | Tragic 5.8% |
| Lithuanians | 6.7 /100 | #221 | Tragic 5.8% |
| Immigrants | Sudan | 6.7 /100 | #222 | Tragic 5.8% |