German vs Immigrants from Middle Africa Wage/Income Gap
COMPARE
German
Immigrants from Middle Africa
Wage/Income Gap
Wage/Income Gap Comparison
Germans
Immigrants from Middle Africa
29.2%
WAGE/INCOME GAP
0.0/ 100
METRIC RATING
330th/ 347
METRIC RANK
22.4%
WAGE/INCOME GAP
100.0/ 100
METRIC RATING
60th/ 347
METRIC RANK
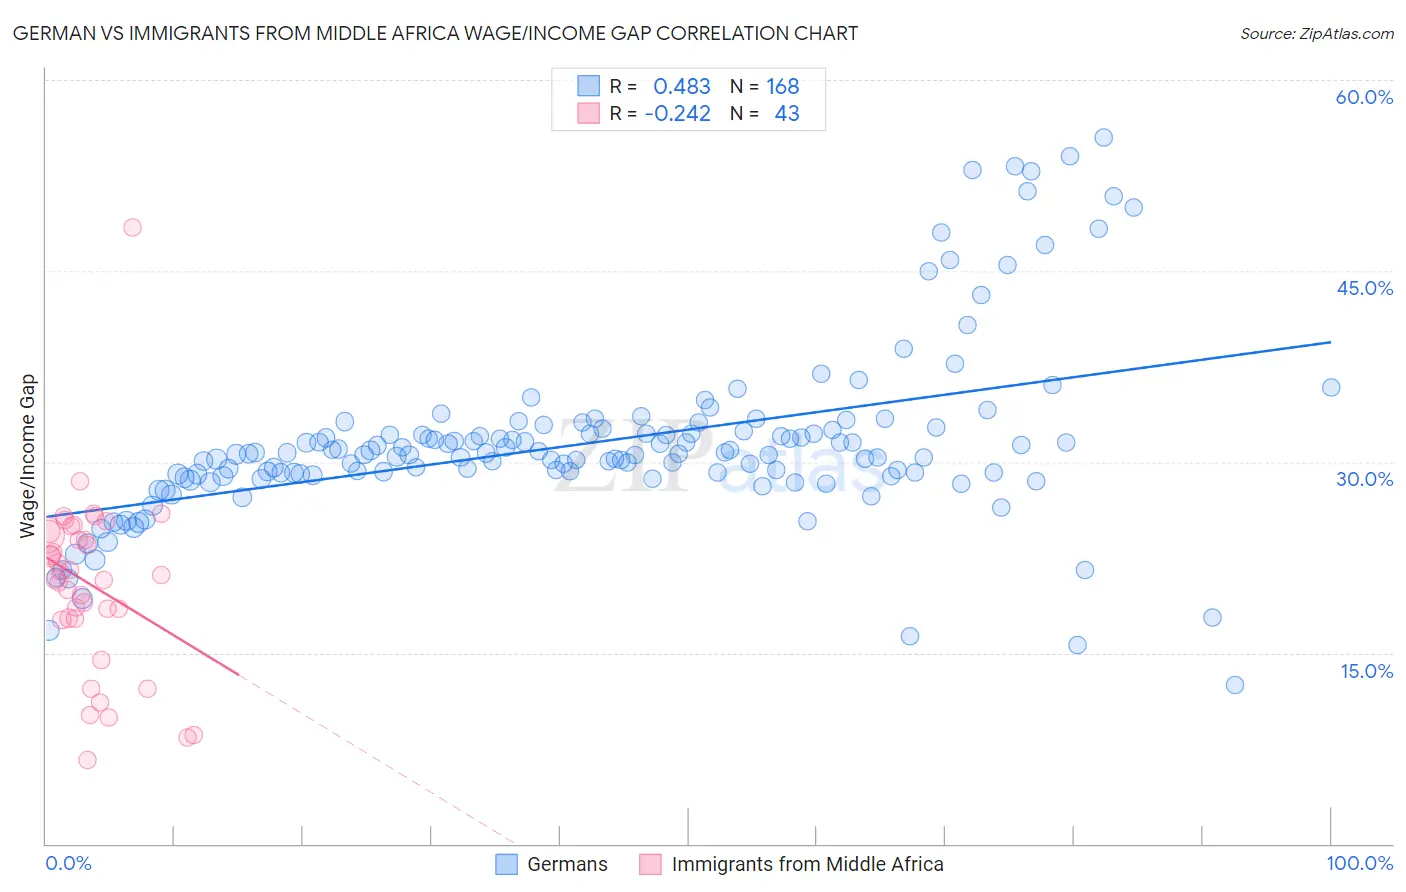
German vs Immigrants from Middle Africa Wage/Income Gap Correlation Chart
The statistical analysis conducted on geographies consisting of 576,849,006 people shows a moderate positive correlation between the proportion of Germans and wage/income gap percentage in the United States with a correlation coefficient (R) of 0.483 and weighted average of 29.2%. Similarly, the statistical analysis conducted on geographies consisting of 202,693,436 people shows a weak negative correlation between the proportion of Immigrants from Middle Africa and wage/income gap percentage in the United States with a correlation coefficient (R) of -0.242 and weighted average of 22.4%, a difference of 30.4%.
Wage/Income Gap Correlation Summary
| Measurement | German | Immigrants from Middle Africa |
| Minimum | 12.4% | 6.5% |
| Maximum | 55.5% | 48.4% |
| Range | 43.0% | 41.9% |
| Mean | 31.5% | 20.4% |
| Median | 30.6% | 21.1% |
| Interquartile 25% (IQ1) | 29.0% | 17.7% |
| Interquartile 75% (IQ3) | 32.3% | 24.5% |
| Interquartile Range (IQR) | 3.3% | 6.9% |
| Standard Deviation (Sample) | 7.0% | 7.1% |
| Standard Deviation (Population) | 7.0% | 7.1% |
Similar Demographics by Wage/Income Gap
Demographics Similar to Germans by Wage/Income Gap
In terms of wage/income gap, the demographic groups most similar to Germans are Czech (29.2%, a difference of 0.050%), Scottish (29.1%, a difference of 0.10%), Scandinavian (29.1%, a difference of 0.24%), Immigrants from Iran (29.1%, a difference of 0.30%), and Immigrants from Belgium (29.0%, a difference of 0.41%).
| Demographics | Rating | Rank | Wage/Income Gap |
| Norwegians | 0.1 /100 | #323 | Tragic 29.0% |
| Croatians | 0.0 /100 | #324 | Tragic 29.0% |
| Hungarians | 0.0 /100 | #325 | Tragic 29.0% |
| Immigrants | Belgium | 0.0 /100 | #326 | Tragic 29.0% |
| Immigrants | Iran | 0.0 /100 | #327 | Tragic 29.1% |
| Scandinavians | 0.0 /100 | #328 | Tragic 29.1% |
| Scottish | 0.0 /100 | #329 | Tragic 29.1% |
| Germans | 0.0 /100 | #330 | Tragic 29.2% |
| Czechs | 0.0 /100 | #331 | Tragic 29.2% |
| Immigrants | South Central Asia | 0.0 /100 | #332 | Tragic 29.3% |
| Europeans | 0.0 /100 | #333 | Tragic 29.4% |
| Swedes | 0.0 /100 | #334 | Tragic 29.4% |
| Immigrants | Taiwan | 0.0 /100 | #335 | Tragic 29.5% |
| English | 0.0 /100 | #336 | Tragic 29.5% |
| Dutch | 0.0 /100 | #337 | Tragic 29.6% |
Demographics Similar to Immigrants from Middle Africa by Wage/Income Gap
In terms of wage/income gap, the demographic groups most similar to Immigrants from Middle Africa are Navajo (22.4%, a difference of 0.020%), Immigrants from Cuba (22.4%, a difference of 0.060%), Ghanaian (22.3%, a difference of 0.14%), Immigrants from Fiji (22.4%, a difference of 0.17%), and Immigrants from Ghana (22.3%, a difference of 0.24%).
| Demographics | Rating | Rank | Wage/Income Gap |
| Bangladeshis | 100.0 /100 | #53 | Exceptional 22.2% |
| Nepalese | 100.0 /100 | #54 | Exceptional 22.2% |
| Immigrants | Zaire | 100.0 /100 | #55 | Exceptional 22.3% |
| Immigrants | Ghana | 100.0 /100 | #56 | Exceptional 22.3% |
| Ghanaians | 100.0 /100 | #57 | Exceptional 22.3% |
| Immigrants | Cuba | 100.0 /100 | #58 | Exceptional 22.4% |
| Navajo | 100.0 /100 | #59 | Exceptional 22.4% |
| Immigrants | Middle Africa | 100.0 /100 | #60 | Exceptional 22.4% |
| Immigrants | Fiji | 100.0 /100 | #61 | Exceptional 22.4% |
| Immigrants | Guatemala | 100.0 /100 | #62 | Exceptional 22.5% |
| Immigrants | Ecuador | 100.0 /100 | #63 | Exceptional 22.5% |
| Spanish American Indians | 100.0 /100 | #64 | Exceptional 22.5% |
| Guatemalans | 99.9 /100 | #65 | Exceptional 22.6% |
| Central American Indians | 99.9 /100 | #66 | Exceptional 22.7% |
| Menominee | 99.9 /100 | #67 | Exceptional 22.7% |