French vs Northern European Unemployment Among Women with Children Ages 6 to 17 years
COMPARE
French
Northern European
Unemployment Among Women with Children Ages 6 to 17 years
Unemployment Among Women with Children Ages 6 to 17 years Comparison
French
Northern Europeans
9.7%
UNEMPLOYMENT AMONG WOMEN WITH CHILDREN AGES 6 TO 17 YEARS
0.1/ 100
METRIC RATING
278th/ 347
METRIC RANK
8.8%
UNEMPLOYMENT AMONG WOMEN WITH CHILDREN AGES 6 TO 17 YEARS
89.2/ 100
METRIC RATING
139th/ 347
METRIC RANK
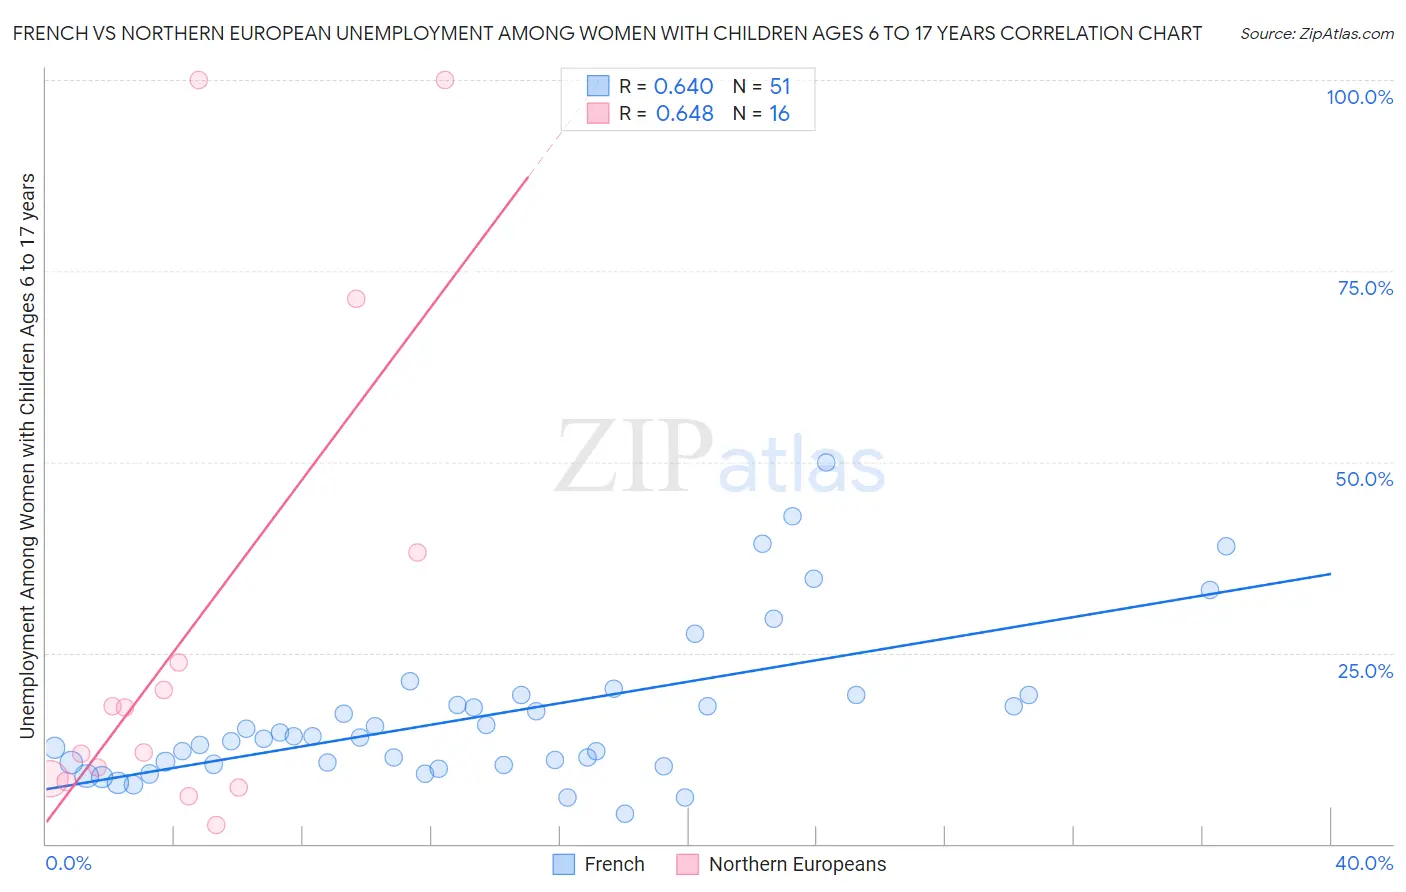
French vs Northern European Unemployment Among Women with Children Ages 6 to 17 years Correlation Chart
The statistical analysis conducted on geographies consisting of 357,857,640 people shows a significant positive correlation between the proportion of French and unemployment rate among women with children between the ages 6 and 17 in the United States with a correlation coefficient (R) of 0.640 and weighted average of 9.7%. Similarly, the statistical analysis conducted on geographies consisting of 279,656,078 people shows a significant positive correlation between the proportion of Northern Europeans and unemployment rate among women with children between the ages 6 and 17 in the United States with a correlation coefficient (R) of 0.648 and weighted average of 8.8%, a difference of 10.8%.
Unemployment Among Women with Children Ages 6 to 17 years Correlation Summary
| Measurement | French | Northern European |
| Minimum | 4.0% | 2.5% |
| Maximum | 49.9% | 100.0% |
| Range | 45.9% | 97.5% |
| Mean | 16.8% | 28.5% |
| Median | 13.8% | 14.8% |
| Interquartile 25% (IQ1) | 10.4% | 8.4% |
| Interquartile 75% (IQ3) | 19.4% | 30.9% |
| Interquartile Range (IQR) | 9.0% | 22.5% |
| Standard Deviation (Sample) | 10.0% | 32.5% |
| Standard Deviation (Population) | 9.9% | 31.4% |
Similar Demographics by Unemployment Among Women with Children Ages 6 to 17 years
Demographics Similar to French by Unemployment Among Women with Children Ages 6 to 17 years
In terms of unemployment among women with children ages 6 to 17 years, the demographic groups most similar to French are Scotch-Irish (9.7%, a difference of 0.030%), British West Indian (9.7%, a difference of 0.070%), Immigrants from Portugal (9.7%, a difference of 0.12%), U.S. Virgin Islander (9.7%, a difference of 0.13%), and Seminole (9.7%, a difference of 0.22%).
| Demographics | Rating | Rank | Unemployment Among Women with Children Ages 6 to 17 years |
| Immigrants | Latin America | 0.1 /100 | #271 | Tragic 9.6% |
| Kiowa | 0.1 /100 | #272 | Tragic 9.6% |
| Whites/Caucasians | 0.1 /100 | #273 | Tragic 9.6% |
| Aleuts | 0.1 /100 | #274 | Tragic 9.6% |
| U.S. Virgin Islanders | 0.1 /100 | #275 | Tragic 9.7% |
| Immigrants | Portugal | 0.1 /100 | #276 | Tragic 9.7% |
| British West Indians | 0.1 /100 | #277 | Tragic 9.7% |
| French | 0.1 /100 | #278 | Tragic 9.7% |
| Scotch-Irish | 0.1 /100 | #279 | Tragic 9.7% |
| Seminole | 0.1 /100 | #280 | Tragic 9.7% |
| Jamaicans | 0.0 /100 | #281 | Tragic 9.8% |
| Slovaks | 0.0 /100 | #282 | Tragic 9.8% |
| Central American Indians | 0.0 /100 | #283 | Tragic 9.9% |
| Yakama | 0.0 /100 | #284 | Tragic 9.9% |
| Hispanics or Latinos | 0.0 /100 | #285 | Tragic 9.9% |
Demographics Similar to Northern Europeans by Unemployment Among Women with Children Ages 6 to 17 years
In terms of unemployment among women with children ages 6 to 17 years, the demographic groups most similar to Northern Europeans are Immigrants from Ethiopia (8.8%, a difference of 0.030%), Immigrants from Argentina (8.7%, a difference of 0.090%), Immigrants from Poland (8.8%, a difference of 0.11%), Immigrants from Latvia (8.7%, a difference of 0.14%), and European (8.7%, a difference of 0.17%).
| Demographics | Rating | Rank | Unemployment Among Women with Children Ages 6 to 17 years |
| Yaqui | 92.2 /100 | #132 | Exceptional 8.7% |
| Egyptians | 91.8 /100 | #133 | Exceptional 8.7% |
| Immigrants | Ireland | 91.0 /100 | #134 | Exceptional 8.7% |
| Europeans | 90.6 /100 | #135 | Exceptional 8.7% |
| Immigrants | Latvia | 90.4 /100 | #136 | Exceptional 8.7% |
| Immigrants | Argentina | 90.0 /100 | #137 | Excellent 8.7% |
| Immigrants | Ethiopia | 89.5 /100 | #138 | Excellent 8.8% |
| Northern Europeans | 89.2 /100 | #139 | Excellent 8.8% |
| Immigrants | Poland | 88.3 /100 | #140 | Excellent 8.8% |
| Serbians | 87.6 /100 | #141 | Excellent 8.8% |
| Immigrants | Austria | 87.5 /100 | #142 | Excellent 8.8% |
| Immigrants | Kenya | 86.1 /100 | #143 | Excellent 8.8% |
| Russians | 85.8 /100 | #144 | Excellent 8.8% |
| Kenyans | 85.6 /100 | #145 | Excellent 8.8% |
| Chileans | 80.8 /100 | #146 | Excellent 8.8% |